Monitor and troubleshoot AI applications on Azure Kubernetes Service
Correlate application logs, resource metrics, Kubernetes events, Pod states, Services, EndpointSlices, ingress, and end-to-end connectivity to diagnose AI workloads on AKS.
Suggested study time: 85 minutes • Intermediate • Complete original rewrite with a concise version of every topic, assessment review, and guided troubleshooting lab
By João Ricardo Dutra••Complete original content
1. Observe the whole AI workload before changing it
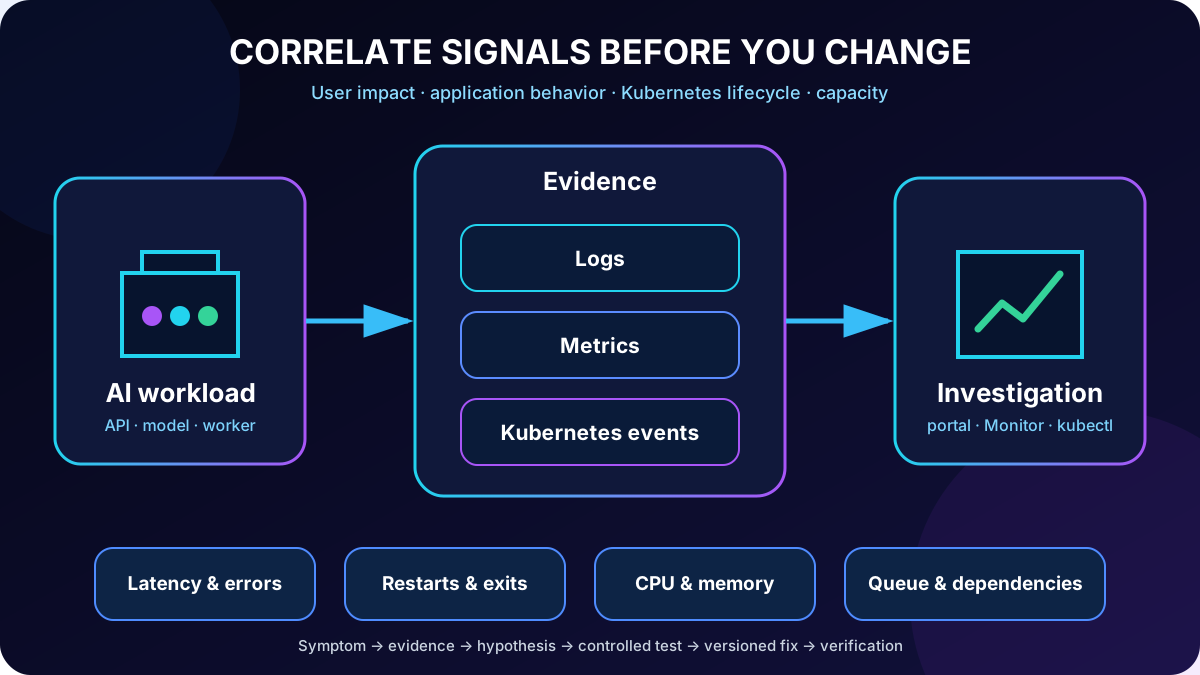
An inference API and a background enrichment worker can both look healthy while users experience slow responses, failed model calls, or stale recommendations. The failure can originate in code, a model dependency, Kubernetes configuration, Service routing, resource pressure, or the cluster itself. Monitoring narrows the search before a change introduces another variable.
offers complementary views. The provides Workloads, Live Logs, Container insights, Monitoring, Console, and Diagnose and solve problems. kubectl exposes resources, logs, events, metrics, and network objects directly. A reliable investigation moves from symptom to evidence, hypothesis, controlled test, durable fix, and verification.
Identify the affected user path and time window.
Compare application, Kubernetes, and infrastructure signals.
Use the portal for fast visual scope and kubectl for precise inspection.
Change source, configuration, or manifests rather than patching a running container.
Topic summary
Start with the user symptom and correlate portal and kubectl evidence before choosing a reversible, reproducible fix.
2. Select logs and metrics that explain AI behavior
Endpoint latency, throughput, HTTP 5xx responses, timeouts, queue depth, batch duration, Pod restarts, exit codes, CPU, and memory describe different layers of the workload. Compare resource utilization with requests and limits: reaching a CPU limit can cause throttling and latency, while memory pressure can trigger termination and repeated restarts.
Signal-to-question map.
Signal
Question answered
Typical action
Latency and throughput
Can the AI endpoint meet demand?
Inspect dependencies, scale, or optimize.
Errors and timeouts
Which requests or upstream calls fail?
Correlate structured logs and traces.
Restarts and exit codes
Is the container stable?
Inspect previous logs, status, and events.
CPU and memory
Is capacity or a limit constraining the Pod?
Right-size or scale replicas.
Queue or batch duration
Is background work accumulating?
Tune concurrency and autoscaling.
A useful signal must connect a user-visible symptom to application, orchestration, or capacity evidence.
Topic summary
Monitor user outcomes, application behavior, Pod lifecycle, and capacity together; no single metric explains the full incident.
3. Inspect live and historical evidence in the
Under Kubernetes resources, Workloads shows status, age, restart count, and details for Deployments, Pods, ReplicaSets, StatefulSets, Jobs, and CronJobs. Live Logs streams container stdout and stderr, supports pause and search, and lets you select a container in a multi-container Pod. Console opens an interactive terminal when browser-based access is preferable.
The cluster Monitoring tab gives a quick node-pool overview and links graphs to metrics explorer. Under Monitoring, Container insights correlates namespaces, controllers, containers, logs, events, CPU, memory, network, and filesystem data. Live data requires appropriate Kubernetes RBAC and direct API access; private clusters require network reachability. Historical collection requires its and Log Analytics configuration.
Topic summary
Use Workloads and live data for the current incident, then use Container insights and for cross-Pod and historical analysis.
4. Read container logs precisely with kubectl
List Pods in the correct namespace, select the failing instance, and stream logs while reproducing the request. The -c flag chooses a container such as an inference API rather than its sidecar. The --previous flag is critical after a restart because current logs can hide the process that just crashed.
Namespaces create logical and access boundaries; labels select a particular application inside that boundary. Prefer timestamps, request IDs, model and version identifiers, status codes, dependency duration, and structured fields. Do not print tokens, prompts with sensitive data, connection strings, or credentials.
Topic summary
Target the correct namespace, Pod, container, and lifecycle instance, then correlate structured logs with the request that reproduces the failure.
5. Compare resource usage with requests and limits
The portal shows CPU and memory by node pool and, through Container insights, by node, controller, Pod, or container. Live Metrics adds a current view of CPU, memory, network, and filesystem behavior. With Metrics Server available, kubectl top provides a fast command-line snapshot.
kubectl top nodes
kubectl top pods -n ai-workloads
kubectl top pod <pod-name> --containers -n ai-workloads
A snapshot is not a trend. Compare the same interval as the latency or error report, the configured requests and limits, desired replicas, node capacity, and throttling or out-of-memory evidence. Sustained CPU at the limit calls for tested changes to CPU settings, replicas, model efficiency, or workload distribution—not simply a larger arbitrary value.
Topic summary
Use portal history and kubectl snapshots together, always comparing measured use with requests, limits, replicas, and service objectives.
6. Build production telemetry that supports investigation
Production observability should define latency and error objectives, retain useful history, and alert before the user impact becomes widespread. Emit structured logs and correlation identifiers that connect gateway, API, model, cache, queue, and worker activity. Record the deployed model and application version so a regression can be tied to a rollout.
Use managed Prometheus and Grafana when time-series metrics and dashboards require them.
Use Container insights and Log Analytics for container output, inventory, and searchable history.
Configure data collection rules, retention, and filters to balance evidence with ingestion cost.
Alert on symptoms and exhaustion risks, and link alerts to a runbook.
Protect telemetry with RBAC and avoid confidential payloads.
Topic summary
Design logs, metrics, alerts, retention, and correlation before an incident so investigators can reconstruct the failing request and deployment.
7. Recognize unhealthy Pod states and their likely causes
Common Pod symptoms.
State or symptom
Likely cause
First evidence
ImagePullBackOff
Wrong image, tag, registry access, or pull identity
Pod events and image reference.
CrashLoopBackOff
Process exits, bad command, configuration, or dependency
Container status, previous logs, events.
Pending
Insufficient resources, affinity, volume, quota, or scheduling rule
Scheduling events and requests.
Frequent restarts
Probe failure, memory pressure, leak, or unhandled exception
Restart count, exit reason, logs, metrics.
Running but not Ready
Readiness probe or dependency is failing
Conditions, probe events, local health response.
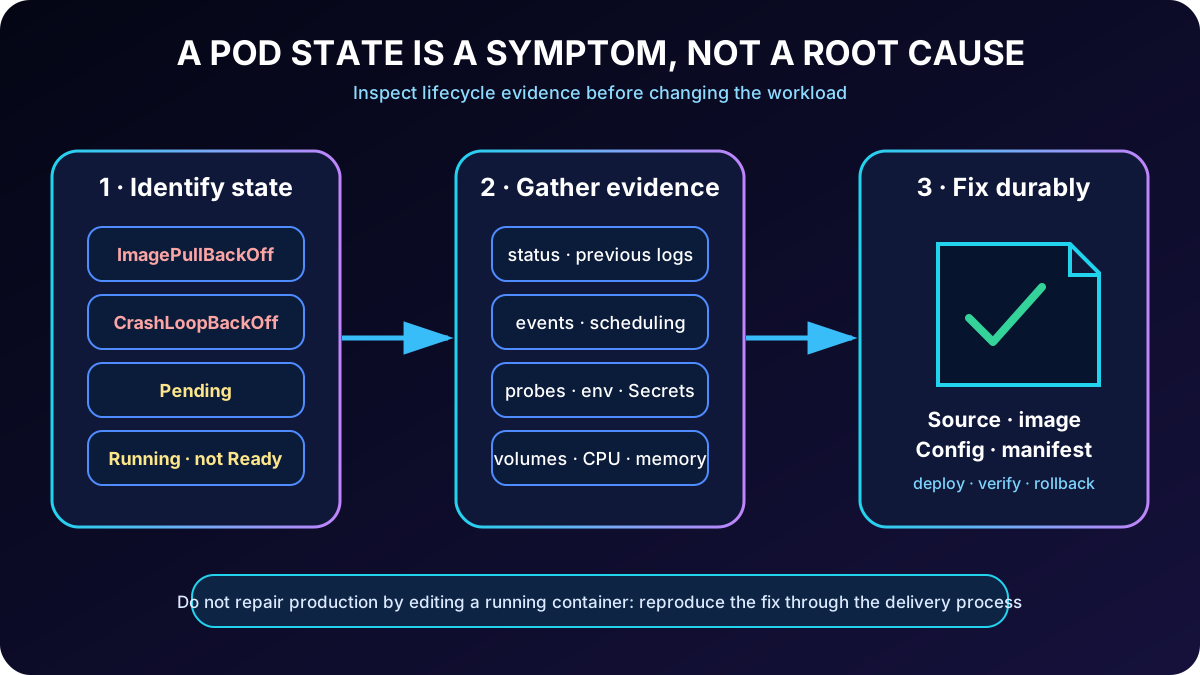
Status names are symptoms; events and runtime evidence reveal the cause.
Topic summary
Treat ImagePullBackOff, CrashLoopBackOff, Pending, restarts, and failed readiness as starting points, not diagnoses.
8. Describe Pods and inspect Kubernetes events
kubectl describe pod combines container state, last termination, probes, environment sources, mounts, scheduling, and a chronological events section. Cluster events reveal failed pulls, placement constraints, probe failures, and controller actions that an application log cannot explain.
kubectl get pods -n ai-workloads
kubectl describe pod <pod-name> -n ai-workloads
kubectl get events -n ai-workloads --sort-by=.metadata.creationTimestamp
kubectl exec -it <pod-name> -n ai-workloads -- /bin/sh
Check readiness and liveness paths and ports, environment variables, ConfigMaps and Secrets, requested resources, mounted model or configuration volumes, service account, image, and recent events. Events can expire, so capture the relevant output during the incident. The portal Diagnose and solve problems experience complements this with cluster-aware detectors and recommended actions.
Topic summary
Use describe and events to connect Pod status to probes, configuration, volumes, scheduling, images, identity, and controller decisions.
9. Debug inside the container without creating configuration drift
The portal Console or kubectl exec can show what the process sees: files, mounted configuration, environment variables, DNS, and local health endpoints. A shell exists only if the image contains one; otherwise use an approved debug or ephemeral-container workflow rather than rebuilding production informally.
Confirm the expected model and configuration files exist.
Check non-sensitive environment values and the presence—not the value—of credentials.
Call localhost health and inference ports.
Resolve DNS names and test permitted upstream endpoints.
Exit without changing the filesystem or installing untracked tools.
Interactive changes vanish with the container and create drift. Once the cause is known, update source, image, ConfigMap, Secret mapping, probe, resources, or manifest, deploy it through the normal process, and retest.
Topic summary
Inspect the runtime from Console or exec, but make the permanent correction in versioned code, configuration, images, or manifests.
10. Validate Service selectors, ports, and EndpointSlices
A healthy Pod does not make an API reachable. A Service normally selects Pods by label; the control plane then records ready backends in EndpointSlices. Empty EndpointSlices usually mean selector and label mismatch, non-ready Pods, or an incorrect namespace. A nonempty slice also exposes the backend IPs, ports, and readiness conditions used for routing.
kubectl get service -n ai-workloads
kubectl describe service inference-api -n ai-workloads
kubectl get pods --show-labels -n ai-workloads
kubectl get endpointslices   -l kubernetes.io/service-name=inference-api   -n ai-workloads
Compare Service selector with Pod labels, Service port with targetPort, targetPort with the container listener, protocol, namespace, and EndpointSlice addresses. The legacy Endpoints object is deprecated in current Kubernetes; use EndpointSlices for modern inspection.
Topic summary
Prove the selector-label-port chain and confirm EndpointSlices contain ready Pod addresses before investigating external routing.
11. Trace ClusterIP, NodePort, LoadBalancer, and ingress paths
ClusterIP is reachable only inside the cluster and is the default choice for internal APIs. NodePort exposes a port on each node and is often a building block rather than the preferred public contract. LoadBalancer provisions an Azure path and an external address. Ingress adds host and path routing through an ingress controller and backend Services.
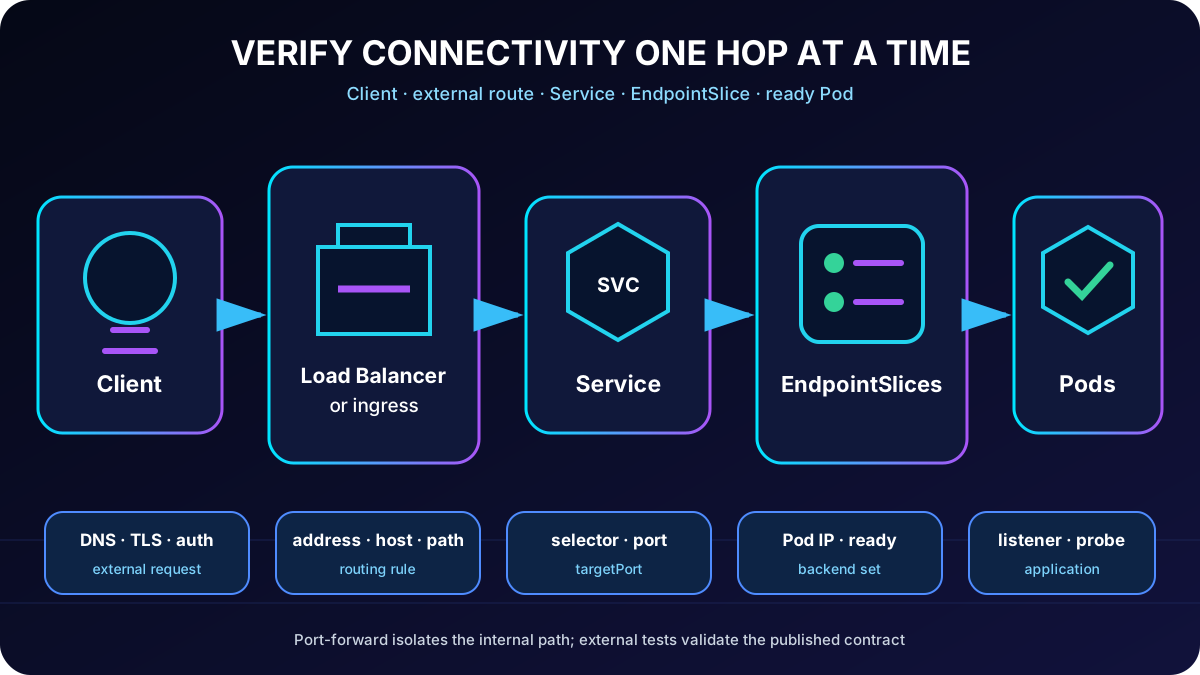
In the , Services and ingresses shows type, cluster IP, external IP, port mappings, selectors, endpoints, ingress hosts, paths, and assigned addresses. Validate one hop at a time: process listener, Pod, EndpointSlice, Service, ingress or load balancer, DNS/TLS if present, and finally the client.
End-to-end success depends on every routing contract, not only on healthy Pods.
Topic summary
Choose the exposure model deliberately and test the path from container port through Service and EndpointSlice to ingress or .
12. Test internal and external connectivity safely
kubectl port-forward creates a temporary local tunnel to a Pod selected through a Service. It is useful before ingress exists or when you need to isolate internal application and Service behavior from the public path. The session ends if the selected Pod terminates and should be rerun; it is a diagnostic channel, not production exposure.
kubectl port-forward service/inference-api 8080:80 -n ai-workloads
curl -i http://localhost:8080/api/inference

kubectl get service inference-api -n ai-workloads
kubectl get ingress -n ai-workloads
Port-forward and call the health or inference endpoint locally.
Correlate the request with logs, metrics, and events.
Confirm the Service external IP or ingress address.
Test from a representative external client, including hostname, path, TLS, and authentication.
Repeat after the fix and observe error and latency signals.
Topic summary
Use port-forward to isolate the internal path, then verify the real or ingress address from an external client.
13. Guided lab: troubleshoot an application on
The approximately 30-minute exercise deploys a containerized API with and , then uses kubectl to inspect Pod status, logs, and events. The learner fixes a Service selector mismatch, a missing environment variable, and an invalid readiness probe path, validates connectivity, and removes Azure resources.
Download the starter project and identify the intentionally broken resources.
Deploy the registry, cluster, image, and Kubernetes manifests.
Reproduce each symptom and gather evidence before editing.
Use kubectl edit or the source manifest to correct selectors, configuration, and probes.
Retest the API, confirm healthy Pods and endpoints, and clean up billable resources.
Prerequisites are an Azure subscription with deployment permissions, , Python 3.12 or later, the latest Azure CLI, and kubectl. Tasks can require pay-as-you-go because free credits might not cover task runs.
Topic summary
The lab practices an evidence-first repair of selectors, environment configuration, and readiness while preserving a reproducible deployment.
14. Assessment, production runbook, and references
Assessment decisions.
Scenario
Correct action
Reason
HTTP 500 and latency during reproduction
kubectl logs -f on the specific Pod
Streams the current application failure.
CrashLoopBackOff
Describe the Pod and inspect status and events
Shows termination and orchestration evidence.
Healthy Pods but no Service endpoints
Describe the Service
Exposes selector and endpoint configuration.
Test before public exposure
kubectl port-forward service/...
Creates a local path to the internal Service.
CPU sustained at its limit
Tune requests/limits or scale out
Restores measured capacity instead of ignoring pressure.
State the symptom, scope, start time, and service objective.
Capture deployment version, logs, metrics, status, events, Services, and EndpointSlices.
Test the smallest hypothesis and record the result.
Apply a versioned change with rollback available.
Verify user traffic and watch the original signals after recovery.
The exam favors the command that observes the failing layer directly; production adds scope, history, change control, rollback, and post-fix verification.