OpenTelemetry and Azure Monitor for AI: traces, spans, Application Insights, and KQL
Instrument a distributed RAG pipeline, propagate W3C trace context, export reliable telemetry, control sampling, and diagnose latency with Application Map, transaction details, and KQL.
Suggested study time: 125 minutes • Intermediate • Complete original rewrite with a concise version of every topic, assessment review, and guided Python lab
By João Ricardo Dutra••Complete original content
1. Scenario and learning objectives
A customer-support RAG solution has an API gateway, an embedding service, a vector search service, and an LLM orchestrator. Most answers arrive in two seconds, but some take more than ten. Each service writes a different log, so timestamps alone cannot prove which operation consumed the time. The target is a p95 below three seconds and a unified view of service health.
Explain observability and the role of traces, metrics, and logs.
Instrument Python with the OpenTelemetry Distro.
Create correlated custom spans for AI-specific operations.
Export and verify telemetry in Application Insights.
Use visual diagnostics and KQL to find latency, failures, and AI workload patterns.
Quick recap
The problem is not a lack of isolated logs; it is the absence of one correlated story for a request crossing every RAG service.
2. Observability and its three pillars
Observability is the ability to infer a system’s internal state from the signals it emits. It is essential in distributed AI because latency, errors, or quality degradation can originate in model calls, retrieval, data access, or orchestration.
Three complementary perspectives
Signal
What it answers
Typical AI example
Metrics
Is behavior changing over time?
Request volume, error rate, token throughput, and p95 duration.
Distributed traces
Where did one request spend time or fail?
The complete gateway → embedding → search → LLM path.
Logs
Why did one operation behave that way?
A timestamped retry reason, validation detail, or model response error.
Metrics reveal that something changed, traces locate the affected stage, and logs supply local detail. Tracing is the focus here, but reliable diagnosis uses all three together.
Quick recap
Metrics detect, traces locate, and logs explain; none of the three replaces the others.
3. OpenTelemetry as a vendor-neutral standard
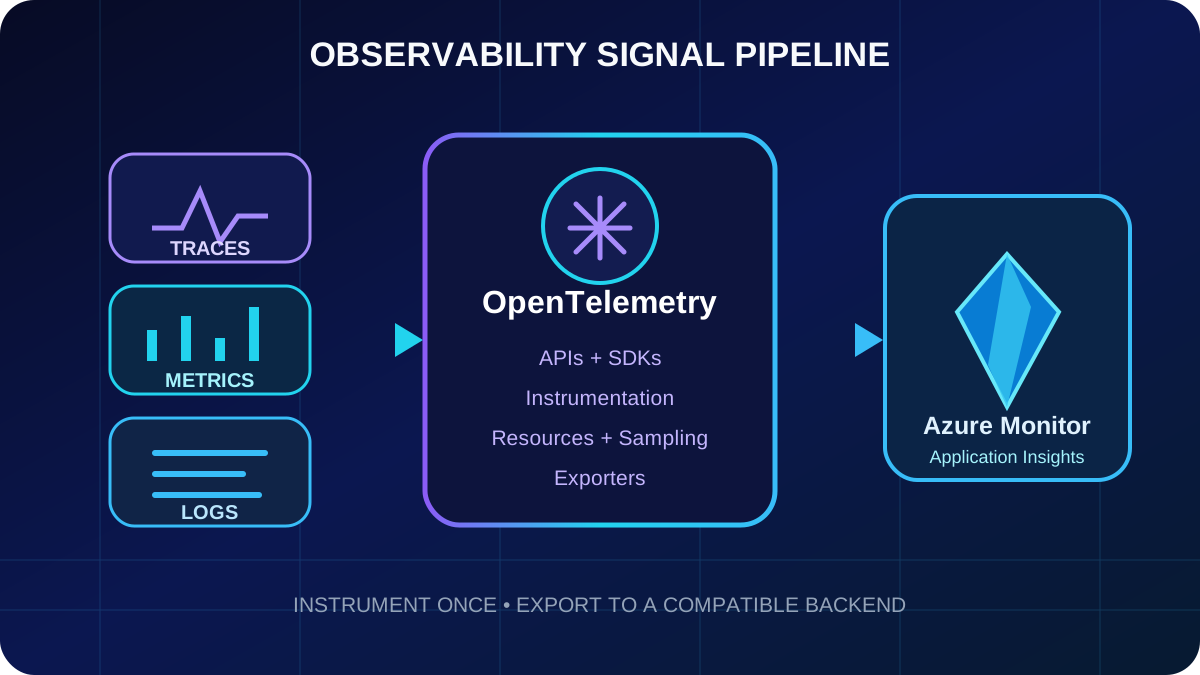
OpenTelemetry is an open-source, vendor-neutral observability framework under the Cloud Native Computing Foundation. Its APIs describe how code produces telemetry; SDKs implement processing, batching, sampling, and resources; instrumentation libraries observe common frameworks; and exporters serialize signals for a backend.
Instrument business code once with stable OpenTelemetry APIs.
Choose , Jaeger, Prometheus, Grafana, or another compatible destination without rewriting business spans.
Use automatic instrumentation for common protocols and manual instrumentation for semantic AI operations.
Keep the telemetry model independent from a single analytics vendor.
OpenTelemetry separates signal production from the destination; the distribution packages the common pieces for Application Insights.
Quick recap
OpenTelemetry standardizes production and transport of telemetry while leaving the analysis backend replaceable.
4. Traces, spans, hierarchy, and W3C context
A trace is the end-to-end record of one distributed operation. Each span is a named, timed unit of work. A span carries a trace ID shared by the whole transaction; its own span ID; the parent span ID when applicable; name; start and end timestamps; attributes; and status.
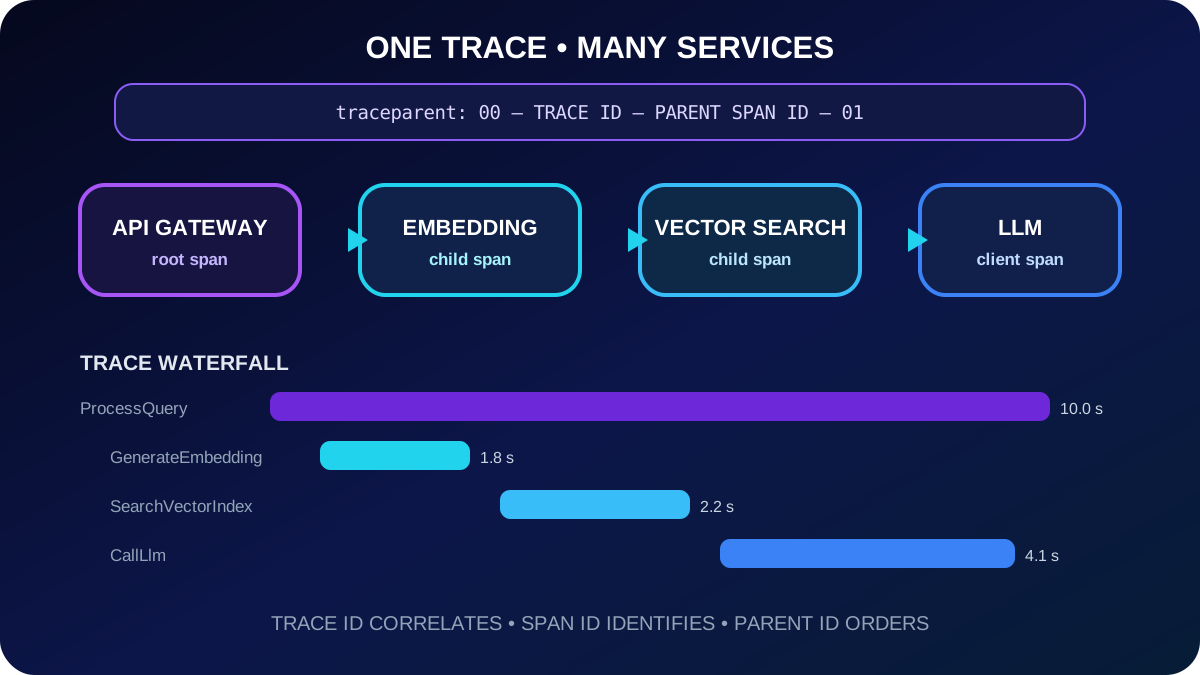
Parent-child relationships form a tree. The gateway request is the root; embedding, search, and model calls become descendants. OpenTelemetry carries this relationship across HTTP boundaries with W3C TraceContext. A traceparent header uses version-trace-id-parent-span-id-flags, for example 00-4bf92f3577b34da6a3ce929d0e0e4736-00f067aa0ba902b7-01. The final 01 indicates that the trace is sampled.
Every service keeps the same trace ID, creates its own span ID, and records the caller as parent so the backend can rebuild the waterfall.
Quick recap
A shared trace ID correlates the journey; span and parent IDs preserve causality; traceparent transports the context between services.
5. Map OpenTelemetry to Application Insights
Terminology and storage mapping
OpenTelemetry
Python
Application Insights
Tracer
trace.get_tracer("name")
Instrumentation source; no direct telemetry row.
Span / SERVER / CONSUMER
SpanKind.SERVER or CONSUMER
Request; requests in the classic schema or AppRequests in the workspace schema.
Portal queries created from an Application Insights resource commonly use the classic table names shown in the examples. Workspace-level transformations use AppRequests, AppDependencies, AppTraces, AppExceptions, and AppMetrics. operation_Id is the correlation key across the classic tables.
Quick recap
Span kind decides whether an operation is a request or dependency, while operation_Id links every item in the distributed transaction.
6. Choose automatic or code-based instrumentation
Instrumentation approaches
Approach
Best fit
Trade-off
Host autoinstrumentation
Supported , Functions, or VM workloads that need a fast baseline without source changes.
Low effort but limited control over custom business context.
Distro inside the application
AI services that must expose embedding, retrieval, prompt, token, or model operations.
Requires code and governance but provides custom spans, attributes, and sampling.
The OpenTelemetry Distro bundles the Python SDK, exporters, resource detectors, and supported instrumentation. Manual spans complement—not replace—the HTTP, framework, database, SDK, and logging telemetry collected automatically.
Quick recap
Use autoinstrumentation for a baseline and the embedded Distro when the trace must express AI business operations.
7. Install and connect the Python Distro
Install azure-monitor-opentelemetry and call configure_azure_monitor() once at startup. The function configures the global trace, meter, and logger providers. In production, put the Application Insights connection string in APPLICATIONINSIGHTS_CONNECTION_STRING rather than source control.
pip install azure-monitor-opentelemetry

from azure.monitor.opentelemetry import configure_azure_monitor
from opentelemetry import trace

# Read APPLICATIONINSIGHTS_CONNECTION_STRING from the environment.
configure_azure_monitor()
tracer = trace.get_tracer("rag-api")
A connection string identifies the ingestion endpoint and resource. An explicit connection_string argument overrides the corresponding environment value; sampling environment variables are a documented exception and take precedence over sampling arguments. Never print the string in logs.
Quick recap
One startup call establishes the pipeline; keep the resource connection string in deployment configuration, not code.
8. Understand automatic collection
Common Python coverage
Source
Automatically collected telemetry
Flask, Django, FastAPI
Incoming routes as server requests, including duration and status; supported integrations can report uncaught exceptions.
requests, urllib, urllib3
Outgoing HTTP dependencies.
psycopg2
PostgreSQL dependency operations and timing.
Azure SDK client libraries
Calls to supported Azure services.
Python logging
Log records connected to the OpenTelemetry logging pipeline.
Automatic collection removes boilerplate, but it cannot infer that a function is assembling a prompt or that a result count is a retrieval-quality signal. Add manual spans only where they improve the operational story and avoid duplicating already instrumented HTTP or database spans.
Quick recap
Framework and dependency instrumentation provides structure; custom spans provide AI semantics.
9. Identify every service with resource attributes
When several services report to one Application Insights resource, service.name gives each deployable component a distinct cloud role name. service.namespace groups related services, and service.instance.id distinguishes replicas. Without stable role names, unrelated telemetry collapses into one map node.
from azure.monitor.opentelemetry import configure_azure_monitor
from opentelemetry.sdk.resources import Resource

resource = Resource.create({
    "service.name": "embedding-service",
    "service.namespace": "support-rag",
    "service.instance.id": "embedding-01",
})

configure_azure_monitor(resource=resource)
The cloud role name combines service.namespace and service.name when both exist; otherwise it uses service.name. The same attributes can be supplied through OTEL_SERVICE_NAME and OTEL_RESOURCE_ATTRIBUTES. Give the gateway, embedding service, search service, and orchestrator unique names but one namespace.
Quick recap
Resource attributes describe the emitter, not one operation, and make the Application Map topology trustworthy.
10. Create custom spans, attributes, status, and exceptions
trace.get_tracer() obtains an instrumentation source. start_as_current_span() starts a span, makes it current inside the with block, and closes it even when control leaves through an exception. Use namespaced attributes such as embedding.model, embedding.token_count, search.top_k, search.result_count, llm.prompt_tokens, and llm.response_tokens. Values should be strings, numbers, booleans, or supported sequences; avoid sensitive prompts and generic keys such as value.
from opentelemetry import trace
from opentelemetry.trace import SpanKind, Status, StatusCode

tracer = trace.get_tracer("rag-pipeline")

with tracer.start_as_current_span("SearchVectorIndex") as span:
    span.set_attribute("search.index_name", "support-docs")
    span.set_attribute("search.top_k", 5)
    try:
        results = search_index(embedding, top_k=5)
        span.set_attribute("search.result_count", len(results))
    except Exception as error:
        span.record_exception(error)
        span.set_status(Status(StatusCode.ERROR, "Vector search failed"))
        raise

with tracer.start_as_current_span("CallLlmApi", kind=SpanKind.CLIENT) as span:
    span.set_attribute("gen_ai.request.model", model_name)
    response = call_model(prompt)
An unhandled exception leaving the context manager is recorded and marks the span as error automatically. If code catches it, record_exception() and set_status() preserve the diagnostic evidence before the exception is rethrown or converted. SERVER and CONSUMER represent incoming work; CLIENT and PRODUCER represent outgoing work; INTERNAL is local work and the default.
Quick recap
Custom spans name business work; attributes add searchable context; kind classifies direction; status and exception events preserve failure evidence.
11. Model one RAG request as nested spans
Starting a span while another is current automatically creates a parent-child relationship through Python context variables. No explicit parent object is needed for synchronous nested work.
with tracer.start_as_current_span("ProcessQuery", kind=SpanKind.SERVER):
    with tracer.start_as_current_span("GenerateEmbedding") as embedding_span:
        embedding_span.set_attribute("embedding.token_count", token_count)
        embedding = create_embedding(query)

    with tracer.start_as_current_span("SearchVectorIndex") as search_span:
        documents = search(embedding, top_k=5)
        search_span.set_attribute("search.result_count", len(documents))

    with tracer.start_as_current_span("CallLlm", kind=SpanKind.CLIENT) as llm_span:
        llm_span.set_attribute("llm.prompt_tokens", prompt_tokens)
        answer = generate_answer(query, documents)
        llm_span.set_attribute("llm.response_tokens", answer_tokens)
The resulting waterfall shows ProcessQuery as root and the embedding, search, and LLM operations beneath it. Eight seconds in CallLlm within a ten-second root makes the bottleneck visible; variability isolated to SearchVectorIndex points elsewhere. Across HTTP calls, instrumented clients inject traceparent and instrumented servers extract it.
Quick recap
Nested contexts express local causality automatically; propagated context extends the same trace across process boundaries.
12. Export directly or through a Collector
With direct export, instrumentation feeds the SDK, the exporter serializes batches, and the application sends them to the Application Insights ingestion endpoint. This is the simplest deployment and the Distro default. An OpenTelemetry Collector adds a separate receiving and processing tier for centralized transformations, routing to multiple backends, or organization-wide policy, at the cost of another service to operate.
Direct export minimizes infrastructure; a Collector is justified when centralized processing or multi-backend routing outweighs its operational cost.
Quick recap
Prefer direct export for simplicity; introduce a Collector only for concrete centralized processing or routing requirements.
13. Control trace volume with sampling
Sampling limits trace ingestion cost. Fixed-percentage sampling keeps a representative fraction; rate-limited sampling caps new traces per second. The current Python Distro defaults to a rate-limited sampler when neither strategy is configured. Environment variables OTEL_TRACES_SAMPLER and OTEL_TRACES_SAMPLER_ARG can change policy without rebuilding the application.
# Fixed percentage: about 10% of traces.
configure_azure_monitor(sampling_ratio=0.10)

# Or rate limited: at most about 1.5 traces per second.
configure_azure_monitor(traces_per_second=1.5)

# Equivalent environment configuration:
export OTEL_TRACES_SAMPLER="microsoft.fixed_percentage"
export OTEL_TRACES_SAMPLER_ARG="0.10"
Sampling applies to traces, not metrics. Logs can optionally follow trace decisions. A lower rate reduces statistical precision, so alert on unsampled OpenTelemetry metrics where possible and validate Failures and Performance estimates. Sampled items can carry itemCount, which represents the number of events the row stands for; use sum(itemCount) for adjusted counts rather than counting rows.
Quick recap
Choose a rate that controls cost without hiding rare failures, and do not treat raw sampled row counts as total traffic.
14. Survive temporary export failures and verify ingestion
The exporter uses local offline storage for failed transmissions and retries after temporary connectivity problems. A production path must be writable, private, capacity-monitored, and persistent enough for the workload. disable_offline_storage removes that resilience and is appropriate only when policy forbids local persistence or another layer guarantees delivery.
configure_azure_monitor(
    storage_directory="/var/telemetry/support-rag",
    # Keep False in production unless local persistence is prohibited.
    disable_offline_storage=False,
)
Generate test traffic, including one successful and one failing request.
Check the Application Insights overview after the normal ingestion delay.
Open Live Metrics for near-real-time requests, dependencies, and exceptions; it is enabled by default in the Python Distro.
Query recent requests and confirm the expected cloud_RoleName values.
Open one trace and verify that child operations share operation_Id and have correct parentage.
Test a brief network interruption in a controlled environment and monitor retry storage.
Quick recap
Offline storage protects short outages; verification must prove arrival, role identity, correlation, attributes, and recovery—not only that the app still runs.
15. Navigate Application Map and transaction diagnostics
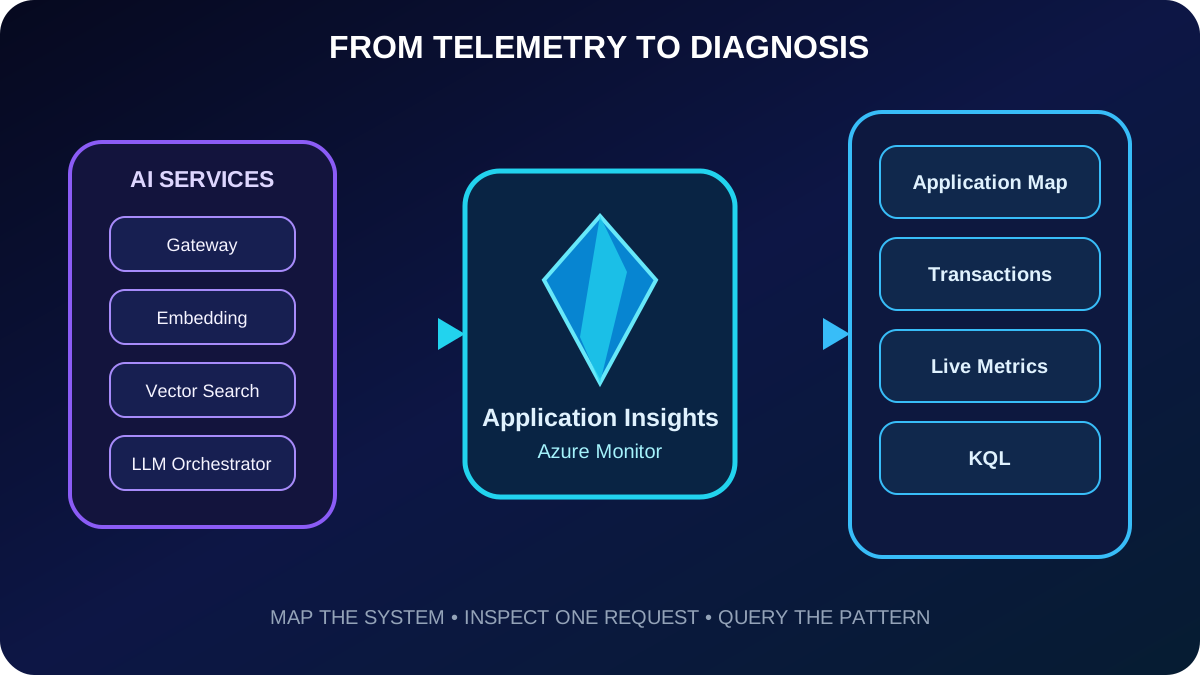
Application Map reconstructs topology from cloud role names and correlated dependencies. Nodes represent instrumented components; edges show calls. Response time, request count, and failure indicators help narrow an investigation before opening individual events.
The end-to-end transaction details view renders a Gantt-style timeline. The root appears first, descendants are indented, sequential work follows horizontally, and concurrent work overlaps. Selecting an event exposes duration, response code, custom properties, and any exception detail. Enter from Performance for slow requests, Failures for errors, Transaction search for a known event, or a map node or edge.
Quick recap
The map finds the suspicious service or relationship; transaction details explains one correlated request in time order.
16. Analyze distributed traces with KQL
KQL answers questions across many traces. requests contains incoming operations, dependencies contains downstream and internal work, traces contains logs, and exceptions contains captured failures. operation_Id is the join key in the classic Application Insights schema.
// Slow server operations by service.
requests
| where timestamp > ago(1h) and duration > 3s
| summarize slowRequests=count(), averageDuration=avg(duration)
    by cloud_RoleName
| order by averageDuration desc

// Dependencies belonging to slow requests.
requests
| where timestamp > ago(1h) and duration > 5s
| project operation_Id, requestName=name, requestDuration=duration
| join kind=inner (
    dependencies
    | project operation_Id, dependencyName=name,
        dependencyDuration=duration, dependencyTarget=target,
        dependencyResult=resultCode
) on operation_Id
| order by requestDuration desc

// Embedding latency segmented by custom span attributes.
dependencies
| where name == "GenerateEmbedding"
| extend model=tostring(customDimensions["embedding.model"]),
    tokenCount=toint(customDimensions["embedding.token_count"])
| summarize averageDuration=avg(duration), p95=percentile(duration, 95),
    averageTokens=avg(tokenCount) by model
Custom dimensions turn traces into AI-aware evidence. Segment embedding duration by model and token count, vector search by result count and threshold, and LLM dependencies by model and token usage. Never record prompts, retrieved private text, credentials, or personal data merely to make a query convenient.
Quick recap
Join on operation_Id, aggregate durations by service or operation, and use carefully selected custom dimensions to test a specific hypothesis.
17. Diagnose AI-specific patterns and complete the lab
Diagnostic pattern
Symptom in telemetry
Likely investigation
Embedding timeout
Long or failed embedding dependency; compare embedding.model across failures.
Vector-search cold start
First search spans after inactivity are slow, then normalize; compare result_count so result volume is not mistaken for startup.
LLM rate limiting
Model dependencies return 429 or contain long retry gaps; correlate prompt and response token attributes.
Context-window overflow
Model call fails when prompt token count approaches the deployment limit; inspect prompt-assembly telemetry without storing prompt text.
Build proactive monitoring with latency and failure alerts, Workbooks for pipeline health, and custom metrics for trends. The guided exercise uses a Python 3.12+ Flask starter, an Azure subscription, , and the latest Azure CLI. It creates Application Insights, configures the Distro, instruments a document pipeline with parent and child spans, generates a simulated latency problem, and diagnoses it in the portal.
Create the Application Insights resource and place its connection string in the environment.
Install the Distro and configure stable service resource attributes.
Add parent and child spans for each document stage plus safe document metadata.
Run the Flask application and generate normal, slow, and failing traffic.
Use Application Map and transaction details to locate the artificial delay.
Reproduce the conclusion with a KQL query and save a useful dashboard or Workbook view.
Remove the exercise resource and local connection string when finished.
export APPLICATIONINSIGHTS_CONNECTION_STRING="<application-insights-connection-string>"
az login
python -m flask --app app run

# Generate normal, slow, and failing requests, then inspect:
# Application Map -> Performance/Failures -> End-to-end transaction details -> Logs.
Quick recap
The lab is complete only when the same bottleneck is supported by topology, one trace, and an aggregate query.
18. Assessment review, final checklist, and references
Assessment decisions
Question
Best answer
Reason
How is trace context propagated over HTTP?
W3C TraceContext in traceparent headers.
It carries the trace ID, parent span ID, version, and flags across services.
Where should the production connection string be configured?
APPLICATIONINSIGHTS_CONNECTION_STRING.
It keeps deployment-specific configuration out of source.
What happens when an unhandled exception leaves start_as_current_span()?
The SDK records it and marks the span as error.
The context manager captures the failure before closing the span.
Where does a CLIENT span appear?
dependencies / AppDependencies.
It represents an outgoing call.
Which field correlates the distributed trace?
operation_Id / OperationId.
It corresponds to the OpenTelemetry trace ID.
Final checklist
Give every service a stable service.name and shared namespace.
Verify traceparent propagation at every process boundary.
Combine automatic instrumentation with a small set of semantic custom spans.
Use namespaced, low-cardinality, nonsensitive attributes.
Classify SERVER, CLIENT, INTERNAL, PRODUCER, and CONSUMER spans correctly.
Choose and document sampling, storage, and retention policies.
Validate Application Map, transaction details, Live Metrics, KQL, alerts, and Workbooks.