How to turn vague symptoms into testable hypotheses, locate the failure layer, and restore services safely
In-depth edition - study material and professional reference
By João Ricardo Dutra••Complete material
Chapter presentation
API troubleshooting rarely starts with an accurate description. The initial report tends to be "the API is down", "the token doesn't work", "it timed out" or "the gateway returned 502". These symptoms are important, but they do not identify the cause. The same response can be produced by different components, and the same failure can appear in different ways depending on the observation point.
An API Gateway occupies a privileged and complex position: it terminates client connections, executes TLS, validates identity, applies policies, transforms messages, creates connections with backends and records telemetry. This means it can detect previous problems, produce errors of its own, or just propagate dependency failures. Investigating correctly requires separating each part of the communication and distinguishing observed evidence from a that has not yet been confirmed.
The methodology in this chapter combines layered reasoning, construction, distributed correlation and change analysis. The professional learns to start with the impact and scope, confirm the path actually taken, locate the last successful step and select tools compatible with the . The goal is not to execute all available commands, but to obtain the minimum evidence that discriminates between possible causes.
Operation during incidents will also be discussed: containment, , evidence preservation, communication, remediation validation, and post-incident analysis. Mature troubleshooting doesn't end when the graph returns to normal; it records , fixes detection gaps, reduces recurrence, and transforms tacit knowledge into runbooks and automation.
How to study this chapter Choose a real or fictitious request and always keep the same fields: consumer, time zone, host, resolved IP, port, method, URI, request ID, , status, latency and selected backend. Redo each section asking what evidence would confirm or rule out the .
Learning Objectives
Apply a -and evidence-driven methodology to API incidents.
Define impact, scope, and correlated change before changing components.
Find faults between client, DNS, network, gateway, backend and dependencies.
Diagnose TCP, NAT, TLS, mTLS, HTTP, authentication and authorization issues.
Distinguish errors produced by the gateway from responses propagated by the backend.
Investigate policies, routing, transformations, rate limits, retries and timeouts.
Use logs, metrics, traces, network captures and synthetic tests in a complementary way.
Diagnose APIs in Kubernetes, service mesh and multi-region environments.
Safely conduct containment, remediation, validation, and post-incident analysis.
Create checklists, runbooks, and reusable evidence for support and engineering teams.
Chapter structure
39.1 Troubleshooting as a scientific process
39.2 Impact, scope, and changes
39.3 Layer model and real request path
39.4 DNS, addressing and balancing
39.5 TCP, sockets, NAT, SNAT and connectivity
39.6 TLS, mTLS, certificates and trust
39.7 HTTP, status codes and error semantics
39.8 Authentication, authorization and identity
39.9 Policies, routing and transformation at the gateway
39.10 Backends, data, queues and third parties
39.11 Timeouts, retries, rate limits and cascading failures
39.12 Kubernetes, service mesh and cloud
39.13 Logs, metrics, tracing and correlation
39.14 Tools and safe evidence collection
39.15 Incident, runbooks and post-incident management
39.16 Case studies
Summary, checklist, exercises, glossary and references
39.1 Troubleshooting as a scientific process
Efficient troubleshooting follows a sequence similar to the scientific method: observe the symptom, formulate hypotheses, predict what evidence would be expected, perform a controlled test, and update understanding. The value of this approach is in avoiding simultaneous changes and coincidental conclusions. Restarting a component and seeing service come back does not prove that the cause was in that component; it just shows that the restart changed the system state.
A must be specific enough to be tested. "The network is bad" is vague. "Gateway is unable to open TCP connection to backend 10.20.30.40:8443 from production subnet" is verifiable. This formulation determines the test point, tool, time, and expected evidence. If SYN receives RST, the changes; if there is no response, another family of causes takes priority.
The investigator also needs to distinguish cause, contributing condition, and symptom. An expired certificate may be the immediate cause, while lack of monitoring and manual renewal process are contributing conditions. The 502 error observed by the client is a symptom. A mature analysis records all three levels, as correcting only the certificate restores the service, but does not prevent recurrence.
Rule of thumb Change one variable at a time whenever risk allows. Before taking a destructive action, capture logs, metrics, configuration state, connections, certificates, and identifiers needed to reconstruct the incident.
39.2 Impact, scope, and changes
The investigation begins with the impact: which operations, consumers, regions, environments and volumes are affected? An isolated error from a client could point to credential or local configuration; a failure on all consumers after a deploy points to shared change. The scope must be refined by method, endpoint, version, tenant, product, certificate, gateway, and backend.
The organizes facts in order. Record perceived start, first alert, last known success, deploys, certificate rotation, DNS changes, firewall changes, escalations and actions. Use synchronized clocks and indicate time zone. Differences of just a few minutes can reverse the apparent relationship between cause and effect.
Recent changes are strong candidates, but should not dominate analysis without evidence. Certificate expiration, gradual port exhaustion, queue growth and external partner changes can occur without local deployment. The investigator must compare the current state with a known : configuration, policy, version, certificate, route, limits, number of connections and traffic behavior.
Table 1 - Initial questions quickly reduce the search space.
Question
Useful response example
Evidence
Who is affected?
Only external partners in the South region.
Metrics by consumer and region.
Since when?
First error at 14:32:18 EDT.
Logs and alert with timestamp.
What changed?
Policy published at 14:29.
Audit log and configuration diff.
What's your latest success?
Request ID abc at 14:31:54.
Complete trace and access log.
39.3 Layer model and real request path
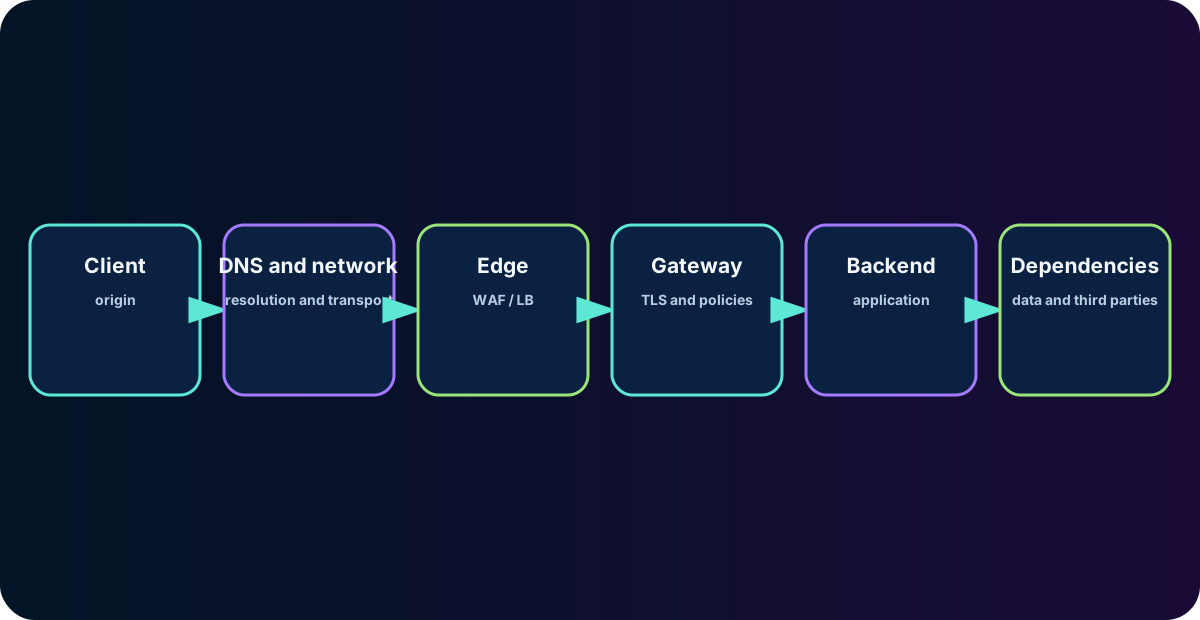
The path drawn in architecture does not always correspond to the real path. DNS may return different addresses by location; a WAF can terminate TLS; API Gateway can use another proxy to reach the backend; a service mesh can insert sidecars; and the answer may go through a different route. Before completing, confirm the effective hops and connection termination points.
The layer model helps locate the fault. If the name does not resolve, there is no TCP connection. If the TCP handshake fails, TLS has not started. If TLS completes and there is an HTTP 401 response, the network and encryption have already worked until a component capable of interpreting HTTP. If the gateway registers the request and the backend does not, the investigation focuses on the gateway-backend section or the policy prior to routing.
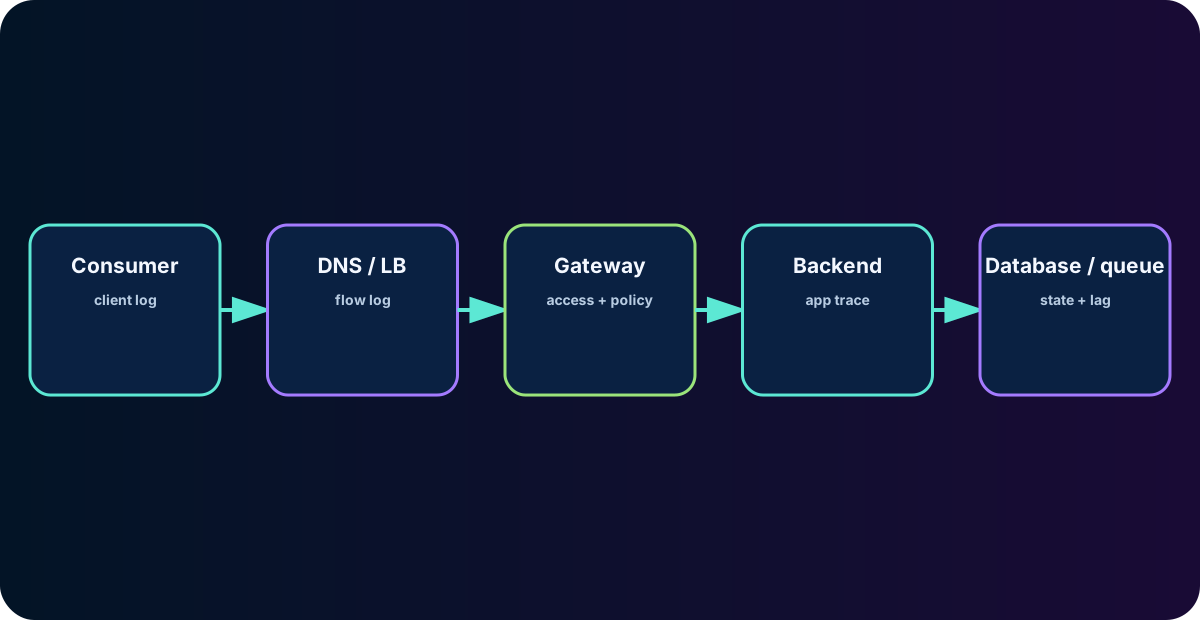
The most useful technique is to identify the last evidence of success and the first evidence of failure. This boundary reduces the problem. A trace shows the gateway initiating a downstream call, but without backend span: check propagation, network or connection. The backend records the successful operation, but the client receives timeout: investigate response, buffers, return connection and external deadline.
Figure 1 - The layered model organizes responsibilities and avoids investigating the application before confirming network and transport.Figure 2 - Different observation points reveal different stages of the same transaction.
39.4 DNS, addressing and balancing
DNS failures include NXDOMAIN, SERVFAIL, resolver timeout, incorrect response, inconsistent split-horizon, outdated cache, and resolution to unsupported IP family. The test must be run from the same environment as the affected runtime. Resolving the name in the analyst's notebook does not prove that the container, pod or gateway uses the same DNS server, search domain or route.
Compare response, TTL, CNAME string, A and AAAA records, and authoritative servers. In recent changes, note intermediate caches and persistent connections: changing DNS does not move already established connections. In private environments, confirm private zones, network links, and conditional forwarders. A difference between environments may indicate that the public name is being resolved where there should be a private response.
When balancing, check health checks, eligible pool, algorithm, affinity and drainage. A backend may respond to the superficial health check and fail in the actual operation. Balancer and gateway logs should indicate which instance was selected. Uneven distribution may result from persistent connections, weights, sticky sessions, or a small number of clients.
DNS Watch Commands # Linux / macOS dig api.company.example A dig api.company.example AAAA dig +trace api.company.example # Windows PowerShell Resolve-DnsName api.company.example -Type A Resolve-DnsName api.company.example -Server 10.0.0.10
39.5 TCP, sockets, NAT, SNAT and connectivity
Connectivity must be tested by source, destination, protocol and port. Ping does not validate an API and can be blocked. The relevant test is to open TCP connection from the same network namespace as the affected component. Connection refused typically indicates RST, missing listener, or active rejection. suggests no response, route, firewall, or loss. Connection reset during use indicates abrupt termination by peer or intermediary.
In gateways, there are at least two independent connections: client-gateway and gateway-backend. Each has its own IPs, ports, certificates, pools and timeouts. A call may correctly arrive at the external listener and fail to obtain ephemeral port, traverse SNAT, or reuse a backend connection already closed by the other side.
Exhaustion of SNAT and ephemeral ports appears as intermittent failure under load. Investigate number of destinations, rate of new connections, keep-alive, pooling, TIME_WAIT, NAT limits and distribution by outgoing IP. Packet capture and flow logs help distinguish missing SYN-ACK, RST and retransmissions. Always preserve the exact point of capture, as the same connection may appear translated in each jump.
Table 2 - Transport symptoms must be associated with network evidence.
Symptom
Main
Next evidence
Connection refused
Nothing listens or there is active rejection.
Capture with RST and listener state.
Firewall, route, loss or destination unavailable.
Retransmitted SYN and flow logs.
Reset after a few seconds
Idle timeout or peer terminated.
FIN/RST and pool configuration.
Flashing under load
SNAT, backlog or ephemeral ports.
Connections, TIMEWAIT and NAT metrics.
39.6 TLS, mTLS, certificates and trust
TLS flaws require distinguishing protocol, cipher, certificate, name and trust. The client may reject an expired certificate, incomplete chain, untrusted authority, incompatible hostname, or disallowed algorithm. The server can reject TLS, cipher suite, SNI, or client certificate version. The generic "handshake failed" message needs to be detailed by logs and inspection tools.
In mTLS, check whether the server requested the certificate, which string the client sent, whether the corresponding private key is available, and whether the identity meets the policy. Certificates may be correct in the filesystem and missing in the process due to reload failure. In HSM or Key Vault, investigate permissions, latency, key version, and connectivity.
SNI selects the TLS context before the HTTP Host is processed. Testing by IP without informing SNI may return a default certificate and produce a false diagnosis. For backends, also confirm the name used by the gateway in validation: destination IP, configured hostname, sent SNI and truststore may not match.
Conceptual inspection of TLS and mTLS # Inspect handshake and chain presented openssl s_client -connect api.empresa.example:443 -servername api.empresa.example -showcerts # Test with client certificate openssl s_client -connect backend.internal:8443 -servername backend.internal -cert client.pem -key client.key Operational caution Never copy private keys or real tokens for personal tools, tickets or chats. Collect only what is necessary, use authorized environments, and mask sensitive data before sharing evidence.
39.7 HTTP, status codes and error semantics
HTTP status reports the result observed by a component, not necessarily the . A 401 can come from the gateway, the IdP, or the backend. A 502 generally indicates that an intermediary received an invalid response or was unable to complete upstream communication, but the concrete implementation must be confirmed. A 504 indicates a timeout in the gateway role, while the client may have terminated early and the server continues processing.
Compare status, headers, body and sender component. Headers such as Server, Via, Proxy-Status, request IDs and error formats help identify origin, but can be removed or standardized. Problem Details provides structure for API errors, but the type, title, status, and details fields need to be interpreted in context. Avoid relying solely on the textual message.
Note method, URI, Host, Content-Type, Accept, Content-Length, Transfer-Encoding and encoding. 400 errors can result from parsing, size limit, invalid header, or transformation. 404 may indicate non-existent route, wrong version or hiding policy. 409 may represent state conflict or idempotence. 429 points limit, and Retry-After can guide retry. The 499 code is a non-standard convention used by some proxies for client who have terminated the connection.
Table 3 - Status codes initiate the analysis, but do not alone identify the responsible component.
Code
Initial reading
Diagnostic question
400
Invalid or rejected message.
Who did the parsing and which rule failed?
401 / 403
Missing/invalid authentication or access denied.
Which component decided and with what identity?
429
Limit exceeded.
Which key, window and counter were used?
502 / 503 / 504
Upstream failure, unavailability or timeout.
Did the gateway connect, receive a response, or time out?
39.8 Authentication, authorization and identity
In identity issues, separate credential acquisition, validation, and authorization decision. A client may fail to obtain token; the gateway can reject subscription, issuer, audience or expiration; and the application can accept the token, but deny the operation due to scope, role, relationship with the resource or business policy. Each stage has different evidence and owners.
For JWTs, confirm allowed algorithm, kid, resolved key, exact issuer, audience, exp/nbf/iat times, clock skew and token type. JWKS cache may keep old key; Poorly coordinated rotation can create a failure window. For opaque tokens, check introspection, gateway authentication, timeout, and result caching. Never conclude that the token is valid just because it can be decoded.
Per-object and per-role authorization must be tested with realistic identity. A correct 403 for one user and incorrect for another may indicate claims, group mapping, tenant, ownership or context data. In federation, preserve original issuer and subject before account linking. In mTLS and DPoP, validate the link between token and presented key.
Minimum evidence of identity Register issuer, audience, pseudonymized subject, client_id, scopes/roles, applied policy, decision and reason. Do not register the full token. The hash or secure identifier of the credential is usually sufficient for correlation.
39.9 Policies, routing and transformation at the gateway
Policies can reject, transform, route, cache, call external services, or terminate the flow. The order of execution is part of the behavior. An uninitialized variable, expression with unexpected type or incorrect branch can produce an error far from the apparent point. Compare the published policy with the and use policy tracing when the platform allows it.
In routing, confirm API, version, operation, method, host, path template, rewrite and final backend. Very generic routes can capture inappropriate calls; a slash, encoding or case sensitivity can change the match. In multi-stage gateways, the first component may modify Host, path or headers before the second.
Transformations must be evaluated before and after. Record secure sizes and hashes, not sensitive payloads. JSON/XML errors can occur due to encoding, namespace, schema or optional content. Cache, retry and fallback policies can mask the original failure; temporarily disabling them requires control, approval and testing in a secure environment.
Table 4 - The policy section helps you locate when the flow was interrupted.
Policy stage
Typical failure
Evidence
Inbound
Token, quota or validation rejected.
Policy trace and input context.
Backend
Upstream route, certificate, or connection.
Selected backend and connect log.
Outbound
Transformation or response size.
Original response and post-policy.
On-error
Original error masked.
Internal exception before handler.
39.10 Backends, data, queues and third parties
When the gateway completes forwarding, the investigation moves to the backend and its dependencies. Differentiate queue time, processing, database, external call and serialization. Low CPU does not prove health: the service may be blocked in connection pools, locks, DNS or I/O. Saturation, queues, threads, event loop, and pools metrics are more informative.
Databases may experience slow queries, lock contention, pool exhaustion, delayed replica or failover. The correct answer requires identifying the operation and transactional state. In messaging, check publish confirmation, consumer lag, redelivery, DLQ and ordering. An API may respond 202 correctly and fail later; therefore, the business identifier needs to accompany the asynchronous operation.
Third-party dependencies require separating local and remote failure. Compare DNS, certificate, connect time, , status, rate limit and contract. Circuit breakers may open after a sequence of failures and continue to reject even after remote recovery until the test period. The support agreement must define minimum evidence and time zones.
39.11 Timeouts, retries, rate limits and cascading failures
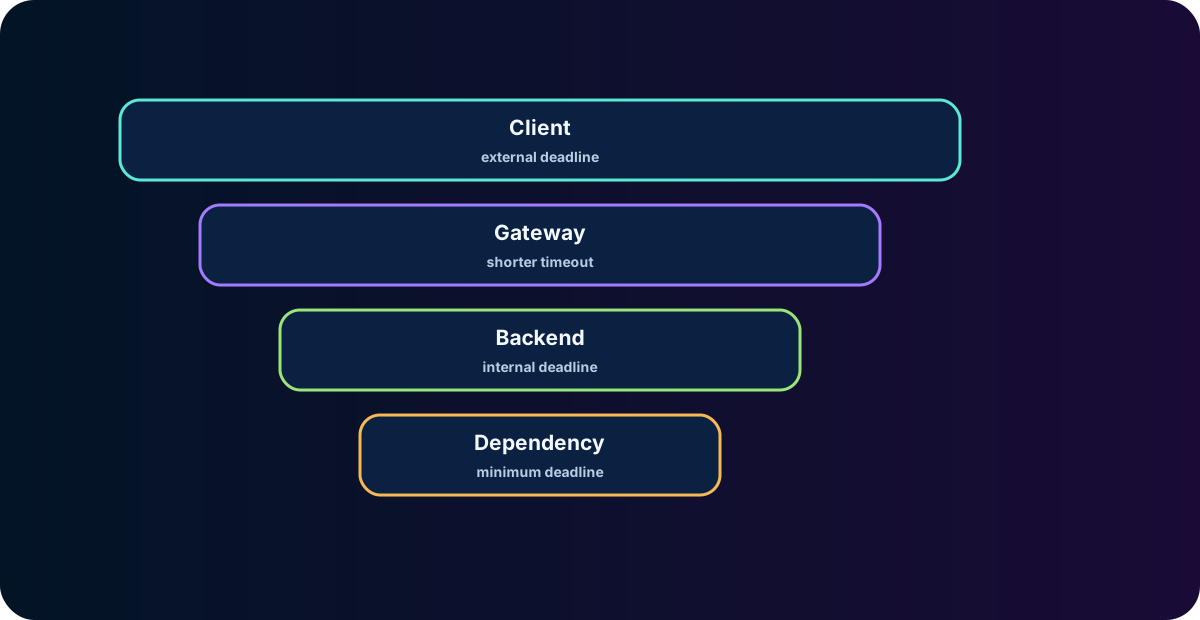
Timeouts need to be analyzed as a budget. The client term contains processing at the edge, gateway, backend, and dependencies. If the gateway's timeout is greater than the client's, the gateway can continue work that no one will receive. If the retry occurs close to the end of the term, it increases the load with no chance of success. Deadlines must be propagated and observed by each layer.
Retries are only safe when the operation is idempotent or protected by an idempotency key. The log must indicate the attempt number, reason, delay and destination. Multi-tier retries multiply calls: three retries on the client, gateway, and backend can produce up to 27 downstream executions. Backoff and jitter reduce synchronization, but do not correct dependency without capacity.
Rate limits and quotas need to reveal key, window, counter and scope. An unexpected 429 could result from shared NAT, incorrect client_id, global counter, or legacy policy. Circuit breakers, bulkheads, queues and load shedding can produce deliberate rejections to protect the system. Troubleshooting must recognize protection working correctly and not remove it without assessing the risk.
Figure 3 - Deadline alignment reduces useless work and makes the expired component identifiable.
39.12 Kubernetes, service mesh and cloud
In Kubernetes, confirm Pod, Deployment, ReplicaSet, Service, EndpointSlice, and ingress route. A Service can exist without ready endpoints. Readiness removes Pods from balance; liveness restarts processes; startup probe protects slow startup. The Pod event, previous container state and termination reason help differentiate application failure, OOMKill, probe and eviction.
Requests and limits influence throttling and scheduling. CPU throttling can increase latency without showing high total CPU. Memory over limit produces OOMKill. Internal DNS, NetworkPolicy, CNI, and kube-proxy/eBPF may affect connectivity. Tests must be done within the Pod or an authorized diagnostic Pod in the same namespace and policy.
In service mesh, there are applications, sidecars or proxies per node and control plane. Check received configuration, workload certificates, clusters/endpoints, retries and authorization policies. A 503 may be generated by the proxy before reaching the service. In the cloud, include private endpoints, NSGs/security groups, route tables, SNAT, load balancers, managed identity and service limits.
Collection commands in an authorized environment # Observation examples in Kubernetes kubectl get pods,svc,endpointslices -n equipe-api kubectl describe pod <pod> -n equipe-api kubectl logs <pod> -c aplicacao --previous kubectl get events -n equipe-api --sort-by=.lastTimestamp
39.13 Logs, metrics, tracing and correlation
Logs show discrete events; metrics show trend and distribution; traces show path and approximate causality. No signal is enough on its own. An elevation of p99 indicates degradation, the trace shows in which span the time was spent and the log explains the specific error. Exemplars can link a metric point to a representative trace.
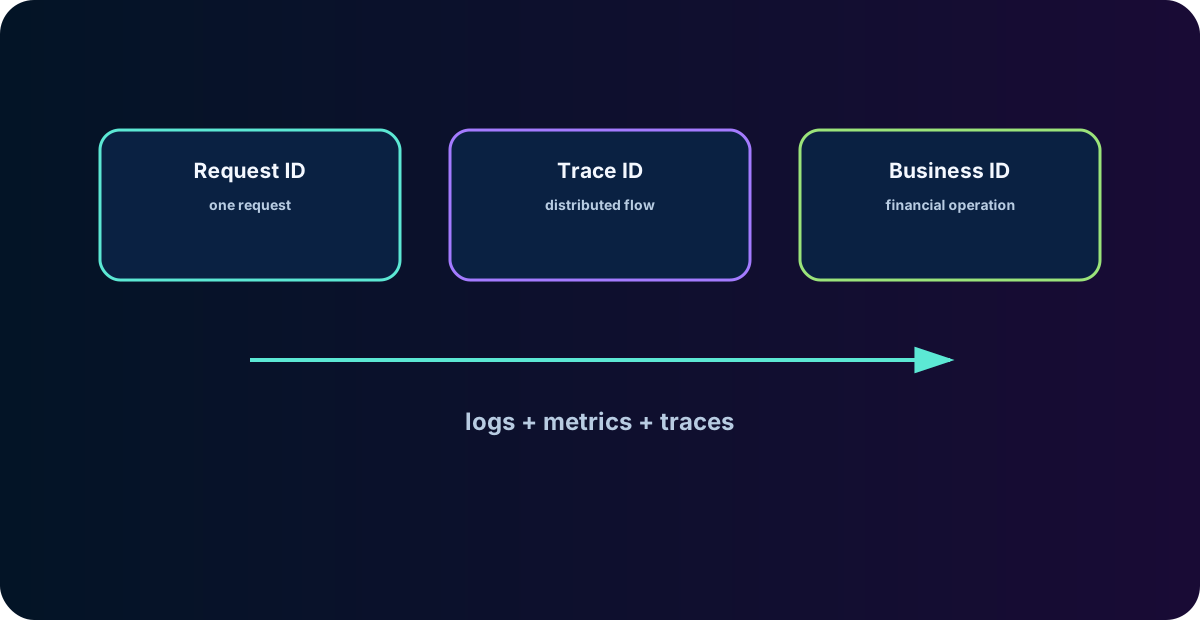
Correlation needs to cross borders. Request ID can be generated at the edge, follows W3C Trace Context and business identifier allows reconciliation. Don't substitute one for the other. The gateway must preserve or regenerate identifiers according to policy, avoiding blindly trusting external values that allow collision or injection into logs.
Uncontrolled cardinality reduces usefulness of metrics. Do not use CPF, full URL, token or request ID as a label. In logs, mask personal data and secrets. Trace sampling can hide rare failures; Tail sampling allows you to retain errors and high latencies, but depends on adequate Collector and capacity. Synchronized clocks are essential for reliable timelines.
Figure 4 - Technical and business identifiers play complementary roles in the investigation.
Tools must be chosen by . curl or Invoke-WebRequest validate HTTP; openssl inspects TLS; dig and Resolve-DnsName look at DNS; ss, netstat and Get-NetTCPConnection show sockets; tcpdump and Wireshark analyze packets; flow logs reveal network decisions; gateway tools show policy and backend; kubectl and mesh interfaces show workload status.
A packet capture must have a minimum scope, duration, and filter. Capture only in an authorized environment and protect the file, as payloads, cookies and tokens may appear in unencrypted traffic or termination endpoints. When TLS prevents content from being read, handshake metadata, sizes, times, retransmissions, and termination are still useful.
Preserving evidence means recording the command, origin, time, version, filters, and file hash. Tickets must contain enough data for playback, but not secrets. For critical environments, automate diagnostic bundles that collect configurations and metrics with masking and access control.
Table 5 - The correct tool depends on the question you want to answer.
Suitable tool
Expected evidence
Name resolves incorrectly
dig /Resolve-DnsName
Response, TTL and server queried.
TLS handshake fails
openssl sclient
SNI, chain, alert and version.
Gateway does not connect
tcpdump / flow logs
SYN, SYN-ACK, RST or drop.
Policy rejects
Platform trace
Filter, variable and error reason.
Slow backend
Trace + metrics
Span, pool, query and saturation.
39.15 Incident, runbooks and post-incident management
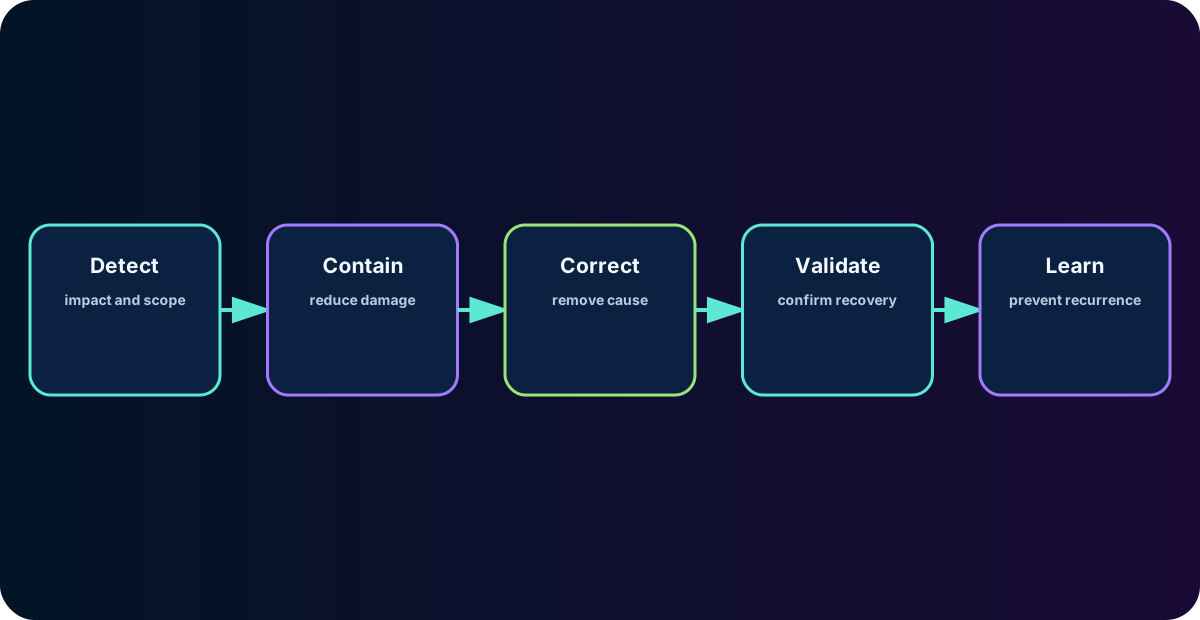
During an incident, the immediate objective is to reduce impact without destroying evidence or creating additional failures. Define incident commander, channel, scribe, technical owners and update frequency. Separate containment actions, such as removing a faulty instance, from permanent fixes. Every action must record time, executor, and result.
Runbooks need to contain criteria, not just commands. A failover procedure should tell you when to run, who approves, what preconditions to check, how to validate integrity, and how to go back. Commands without context can be dangerous. Automation must be tested and produce auditable logs.
Post-incident analysis reconstructs ,, contributing conditions, detection effectiveness, and impact. Avoid attributing the cause to "human error" without asking why the system allowed the action, why the review did not detect it and why the was wide. Actions must be specific, with an owner, deadline and completion criteria.
Figure 5 - Restoring the service is just one step; validating and learning prevent recurrence.
39.16 Case studies
Case 1 - 502 after certificate rotation: Consumers arrive at the gateway, which logs TLS failure to the backend. The new certificate was installed, but the intermediate chain was not added to the gateway's truststore. restores the previous chain; The fix adds automatic bundle validation, window overlay, and synthetic mTLS testing.
Case 2 - peak intermittent timeouts: metrics show an increase in new connections and SNAT ports consumed. The gateway does not reuse connections because the backend terminates keep-alive early. The fix aligns idle timeouts, enables pooling, expands output capacity and monitors free ports. Increasing just the timeout would have worsened saturation.
Case 3 - 401 in one region only: JWT validation uses JWKS cache. A region did not update the key after rotation due to failure to egress to the IdP. The token is valid, but the gateway cannot find the kid. The solution fixes connectivity, safely invalidates the cache, and adds JWKS refresh alert.
Case 4 - 504 with backend completing the operation: the client expires in 5 seconds, the gateway in 30 and the backend in 25. The payment is executed, but the client repeats. The fix introduces propagated deadline, idempotence key, state query and timeout alignment.
Table 6 - Real cases are solved by locating the boundary between success and failure.
Case
Latest evidence of success
502 post-rotation
Gateway received request and initiated TLS backend.
Incomplete chain of trust.
Timeout at peak
SYNs go out, but available ports go down.
due to lack of reuse.
401 regional
Token signed with new kid.
JWKS cache not updated by egress.
504 with effect realized
Backend confirms transaction after customer gives up.
Misaligned deadlines and lack of idempotence.
Chapter summary
Troubleshooting APIs and Gateways is a process guided by hypotheses, and evidence. The investigator starts with impact and scope, confirms the actual path of the request, and finds the last successful step. This approach reduces trial-and-error changes and improves communication between teams.
DNS, TCP, TLS, HTTP, identity, policies, backends, messaging, Kubernetes and service mesh produce their own symptoms, but they interact. Status codes and messages are clues, not evidence of causation. Logs, metrics, traces, captures and audit logs need to be correlated by time and secure identifiers.
Mature operations preserve evidence, contain impact, validate corrections, and transform incidents into improvements. Runbooks, synthetic tests, expiration alerts, configuration diff, observability and automation reduce MTTR and recurrence without compromising security or integrity.
Next step of the course Chapter 40 will study real cases from large companies, applying the fundamentals of architecture, security, resilience and troubleshooting to decisions and incidents known in the market.
Troubleshooting checklist
Impact, scope, environment, region, consumer and operation are defined.
Times use explicit time zone and component clocks are synchronized.
Last known success, first failure, and correlated changes were recorded.
The actual request path and TLS endpoints have been confirmed.
DNS, IP, port, protocol, SNI, Host and selected backend are documented.
Request ID, , gateway transaction ID and business identifier were correlated.
The component that produced the status or error has been identified.
Policies, routes, transformations, limits, cache, retries and timeouts were evaluated.
Backends, banks, queues and third parties have evidence of the same range.
Collections avoid secrets and unnecessary personal data.
The was validated by the entire journey and not just by health check.
, contributing conditions and preventive actions have an owner and deadline.
Exercises
Turn the “API is out” report into five objective screening questions.
Explain how to distinguish , and 504.
Describe an investigation of 401 caused by JWT key rotation.
Show how to identify whether a 502 was produced by the gateway or the backend.
Propose evidence to confirm .
Set a timeout budget for the client, gateway, backend and bank.
Explain why increasing retries can make an incident worse.
Create a for mTLS certificate near expiration.
Describe how to investigate a Kubernetes Service without ready endpoints.
Write a summary for an incident started after a policy change.
Glossary
Table 7 - Essential vocabulary of the chapter.
Term
Definition
Known state used for configuration and behavior comparison.
Scope affected by a failure, change or operational action.
Deadline exceeded before connection was established.
Identifier used to relate events from the same transaction.
Time at which the of the response is received.
Testable explanation for an observed symptom.
Temporary action to reduce impact before definitive correction.
Deadline exceeded waiting for data after connection is established.
Fundamental condition whose removal prevents the incident from recurring.
Operational procedure with criteria, steps, validation and rollback.
Exhaustion of source translation ports or resources.
Automated journey executed periodically to validate the service.
Temporal sequence of facts, changes, symptoms and actions.
Identifier shared by the spans of a distributed transaction.
Technical references
IETF. RFC 9110 - HTTP Semantics.
IETF. RFC 9112 - HTTP/1.1.
IETF. RFC 9113 - HTTP/2.
IETF. RFC 9114 - HTTP/3.
IETF. RFC 8446 - The Transport Layer Security (TLS) Protocol Version 1.3.
IETF. RFC 9209 - The Proxy-Status HTTP Response Header Field.
IETF. RFC 9457 - Problem Details for HTTP APIs.
W3C. Trace Context Recommendation.
OpenTelemetry. Specifications, Collector and Semantic Conventions.
NIST. SP 800-115 - Technical Guide to Information Security Testing and Assessment.
Kubernetes Documentation. Debugging Services, Pods and networking.
Axway Documentation. API Gateway monitoring, tracing and administration.
Microsoft Learn. Azure API Management diagnostics and troubleshooting.
Update note Commands, screens, metrics, and capabilities for gateways, meshes, and managed services vary by version. Before running procedures in production, validate the official documentation of the deployed version, internal runbooks, and necessary authorizations.