Azure Network Watcher: topology, connection monitoring, diagnostics, and flow visibility
Learn to select and operate Topology, Connection Monitor, IP flow verify, NSG diagnostics, next hop, effective security rules, connection troubleshoot, packet capture, VPN troubleshoot, VNet flow logs, and traffic analytics.
Suggested study time: 70 minutes • Intermediate • Original rewrite based on the supplied Microsoft Learn module and corrected against current Azure Network Watcher documentation
By João Ricardo Dutra••Complete original content
1. Build network evidence for a migrated and hybrid estate
Adatum operates three-tier commerce applications on virtual machines spread across several Azure virtual networks. Some tiers were migrated from on-premises datacenters, while hybrid applications still communicate between local and cloud compute. The DevOps networking team needs evidence when filtering, routing, latency, tunnel, or packet-level behavior goes wrong.
Azure Network Watcher supplies that evidence at the Azure network-scenario level. This chapter explains what each tool observes, how it works, and which tool should start a particular investigation.
Distinguish continuous monitoring, point-in-time diagnostics, and traffic analysis.
Visualize topology and monitor Azure or hybrid paths over time.
Diagnose security rules, routes, TCP connections, packets, and VPN gateways.
Collect virtual network flow logs and turn them into operational insights.
Choose Network Watcher only where its scope matches the problem.
Prerequisites are IP addressing, subnetting, routing, network security groups, virtual networks, VPNs, , and peering.
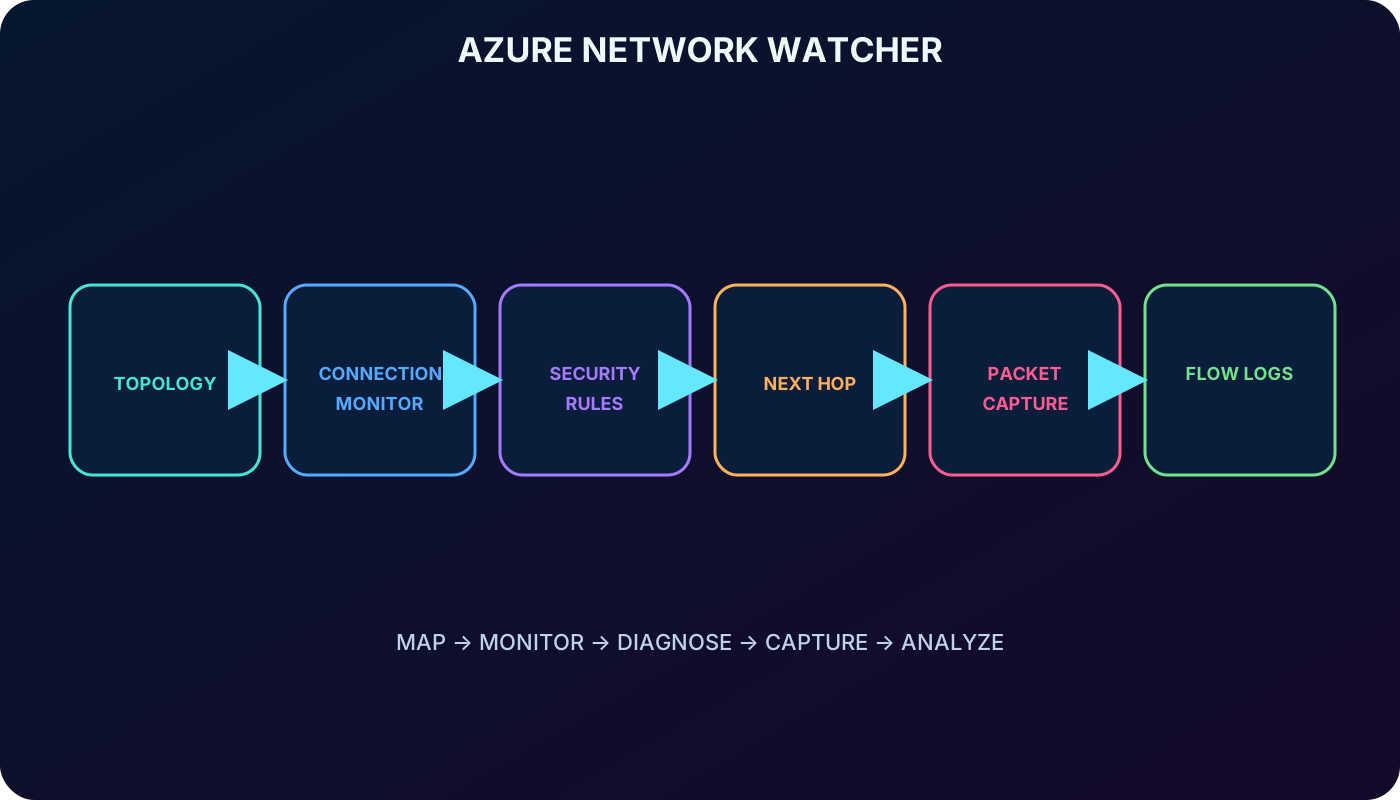
Network Watcher moves an investigation from map, to measurement, to packet decision, to retained evidence.
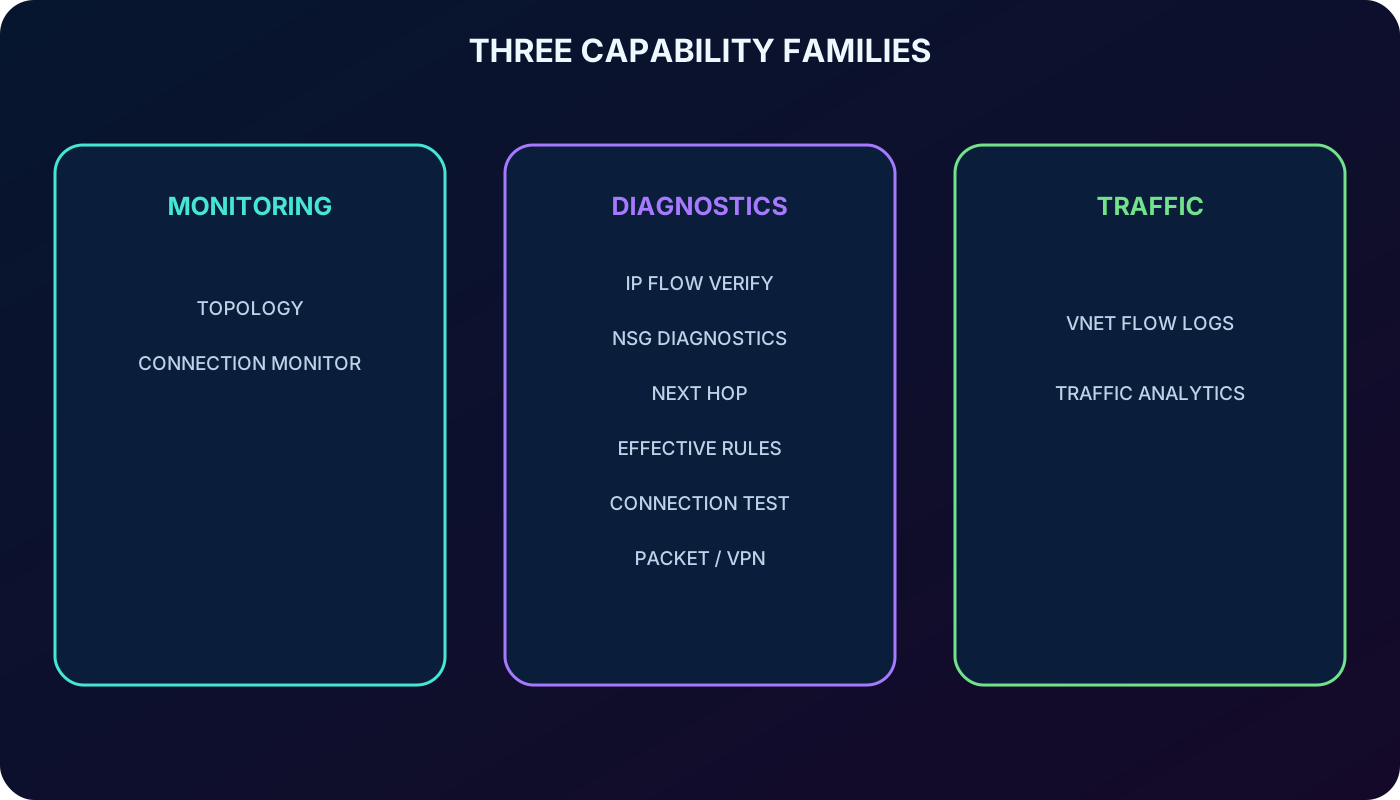
2. Network Watcher groups its capabilities into three families
Network Watcher monitors, diagnoses, displays network metrics, and enables or disables logging for Azure network resources, especially IaaS workloads in virtual networks. It is not an application performance monitor or a web analytics platform.
The three capability families.
Family
Tools
Question answered
Monitoring
Topology; Connection Monitor
What is connected, and is an end-to-end path healthy over time?
Network diagnostics
IP flow verify; NSG diagnostics; next hop; effective security rules; connection troubleshoot; packet capture; VPN troubleshoot
Why is this packet, route, connection, or tunnel behaving this way now?
What traffic patterns and allow/deny decisions occurred over a period?
Select a family before selecting a tool: continuous state, immediate diagnosis, or historical traffic.
3. Regional enablement provides access without deploying an appliance
When a virtual network is created or updated, Network Watcher is automatically enabled in that virtual network’s Azure region unless the subscription opted out. Enablement itself does not alter workload resources and has no charge, though individual features can incur storage, Log Analytics, or processing costs.
There is one Network Watcher instance per subscription and region to unlock the regional capabilities. Use the Azure portal, PowerShell, Azure CLI, or REST interfaces as supported by each diagnostic. Permissions still matter, and some features require the Network Watcher VM extension.
Selected current service limits.
Resource
Limit
Network Watcher instances
1 per subscription per region
Connection monitors
100 per subscription per region
Test groups / sources and destinations / test configurations
20 / 100 / 20 per connection monitor
Packet-capture sessions
10,000 per subscription per region
Concurrent VPN troubleshoot operations
1 per subscription
4. Topology reveals resources and relationships across organizational boundaries
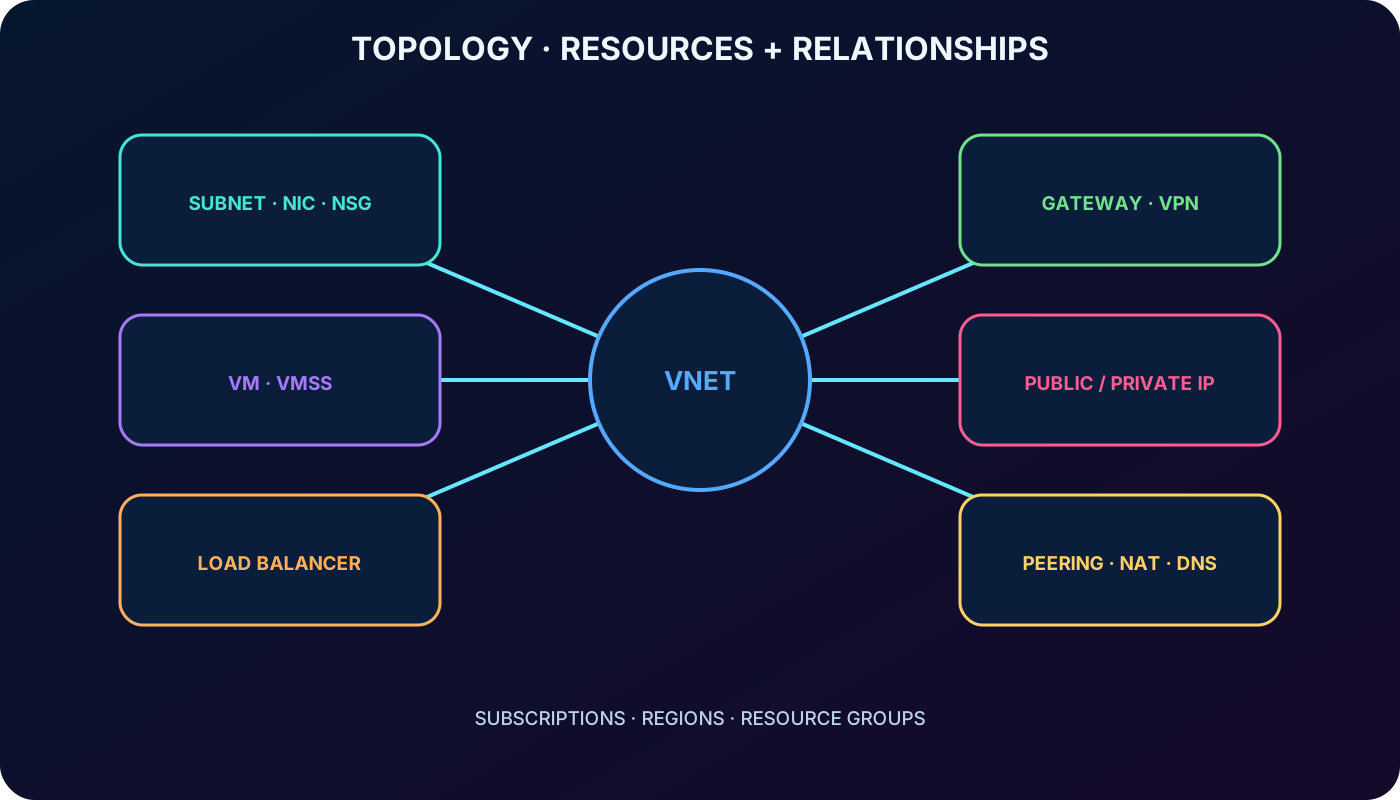
Topology is an interactive graph across subscriptions, regions, and resource groups. It exposes dependencies that a resource-group list can hide and gives contextual access to diagnostics such as connection troubleshoot, packet capture, and next hop.
The supplied module highlights subnets, NICs, NSGs, load balancers and probes, public IPs, peerings, virtual network gateways and VPN connections, VMs, and . The current topology view also recognizes resources such as , Azure Bastion, ,, private endpoints, DNS, Traffic Manager, , and selected topologies.
Topology object metadata from the module.
Property
Meaning
Name
Resource display name.
Id
Resource URI.
Location
Azure region containing the resource.
Associations
Relationships to referenced objects.
AssociationType
Contains or Associated relationship between child and parent.
Association name and ResourceId
Name and URI of the referenced resource.
Begin with the graph to define the complete failure domain before testing one component.
5. Connection Monitor measures a path continuously
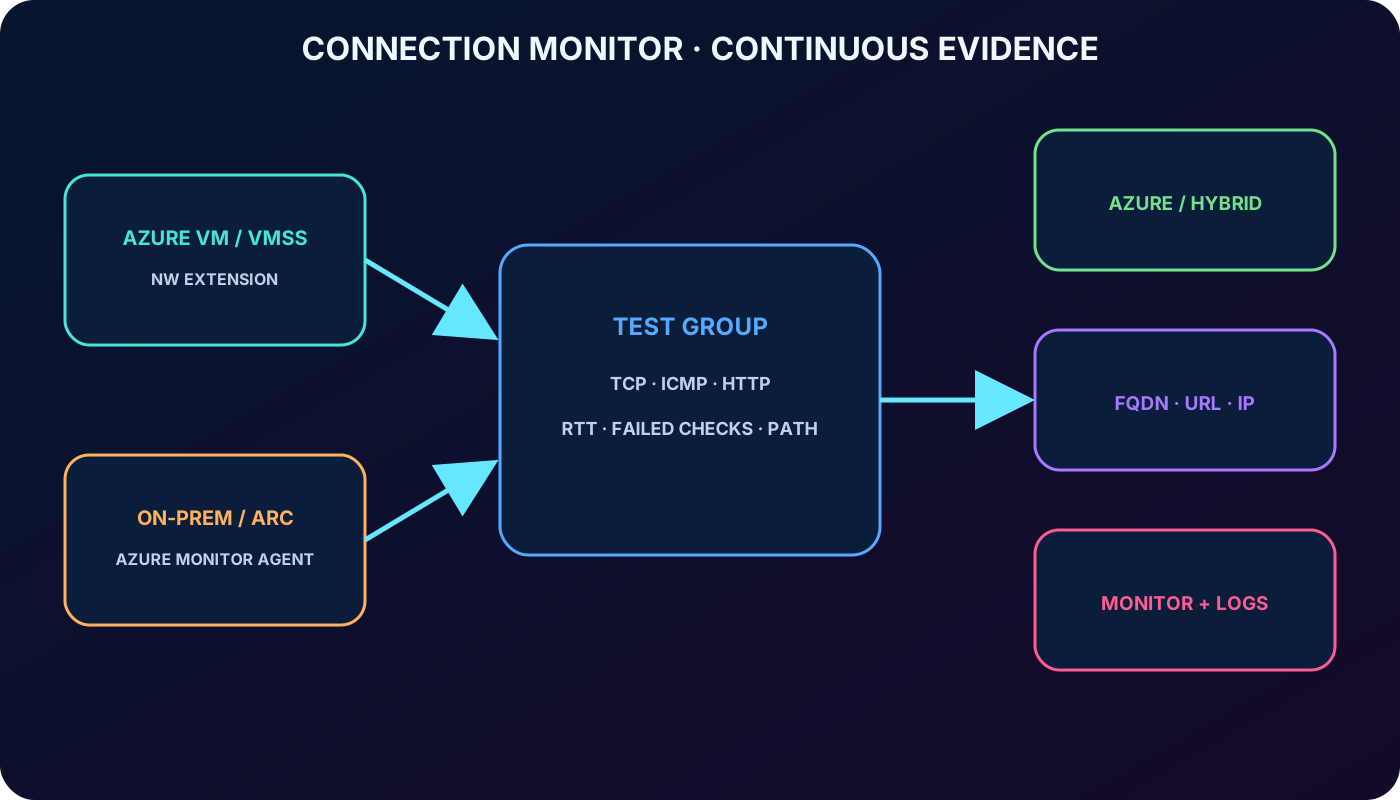
Connection Monitor repeatedly tests reachability and performance between Azure and hybrid endpoints. It detects changes caused by routing, NSG, or other network configuration, reports failed-check percentage and round-trip time, and can surface path topology and actionable explanations.
A connection monitor contains test groups. Each group combines sources, destinations, and protocol-specific test configurations into individual tests. Current probes support TCP, ICMP, and HTTP, with configurable frequency, port, and thresholds. Metrics feed and logs can flow to a Log Analytics workspace for queries, history, and alerts.
Azure VM and scale-set sources require the Network Watcher extension. An on-premises source currently uses an -enabled server and Agent; a destination does not require the extension. The classic Connection Monitor experience is retired, so use the current unified resource.
Connection Monitor is continuous and alertable, not a one-time reachability command.
6. Connection troubleshoot answers a similar question only once
Continuous monitoring versus an on-demand test.
Capability
Connection Monitor
Connection troubleshoot
Time model
Scheduled tests and historical trends
Point-in-time test
Purpose
Detect degradation, failure, or configuration change
Explain a current source-to-destination TCP problem
Outputs
Failed checks, RTT, path, metrics, logs, alerts
Reachability, latency, probes, hops, and identified fault
Typical use
Production SLO and cross-region/hybrid monitoring
Interactive incident diagnosis
7. IP flow verify evaluates one hypothetical packet against policy
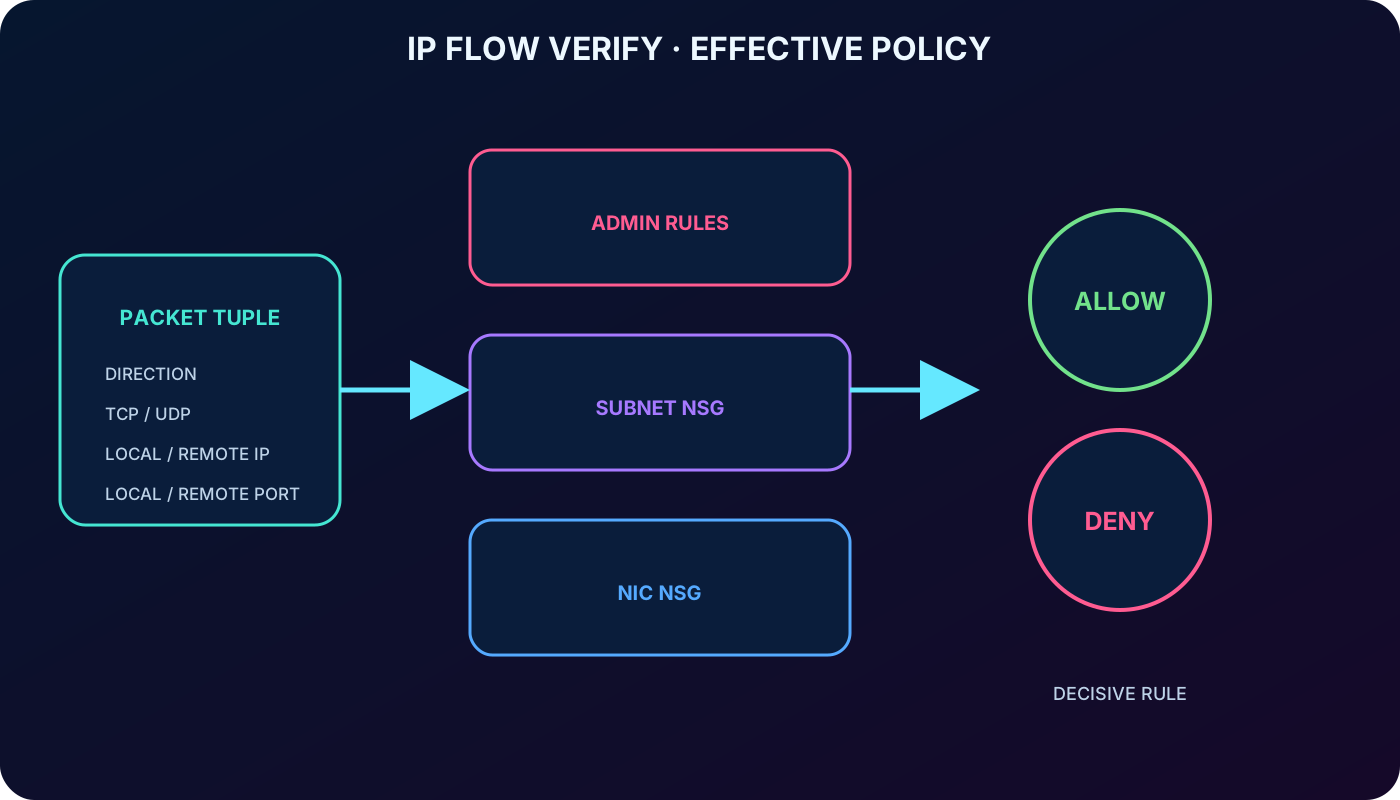
IP flow verify performs a logical policy test for a VM NIC. Supply direction, TCP or UDP, local and remote IPv4 or IPv6 addresses, and local and remote ports. Those values form the packet tuple used to determine whether Azure security and admin rules allow or deny it.
The result identifies the rule responsible. It checks NSGs attached to the NIC or subnet and current Azure Manager security admin rules; it does not send an application request or test a guest firewall. A policy result of Allow therefore does not prove end-to-end connectivity.
Use IP flow verify for one tuple; use effective rules to inspect the aggregate policy.
8. NSG diagnostics and effective security rules provide broader filtering context
NSG diagnostics tests whether traffic is allowed or denied for a VM, instance, or . It accepts an IP, prefix, or service tag and identifies the evaluated security rule. From the diagnostic workflow, you can add or edit a higher-priority rule—meaning a lower priority number—then rerun the check.
Effective security rules aggregates inbound and outbound policy applied to a NIC: its NIC-level NSG, subnet NSG, and Azure Manager admin rules. It is the correct view when multiple policy layers overlap and is also useful for compliance audits.
Security diagnostic selection.
Need
Tool
Check one VM packet tuple and find the decisive rule
IP flow verify
Evaluate VM, scale set, or gateway traffic against IP/prefix/service tag and remediate
NSG diagnostics
List the combined rules that apply to a NIC
Effective security rules
9. Next hop explains the effective routing decision
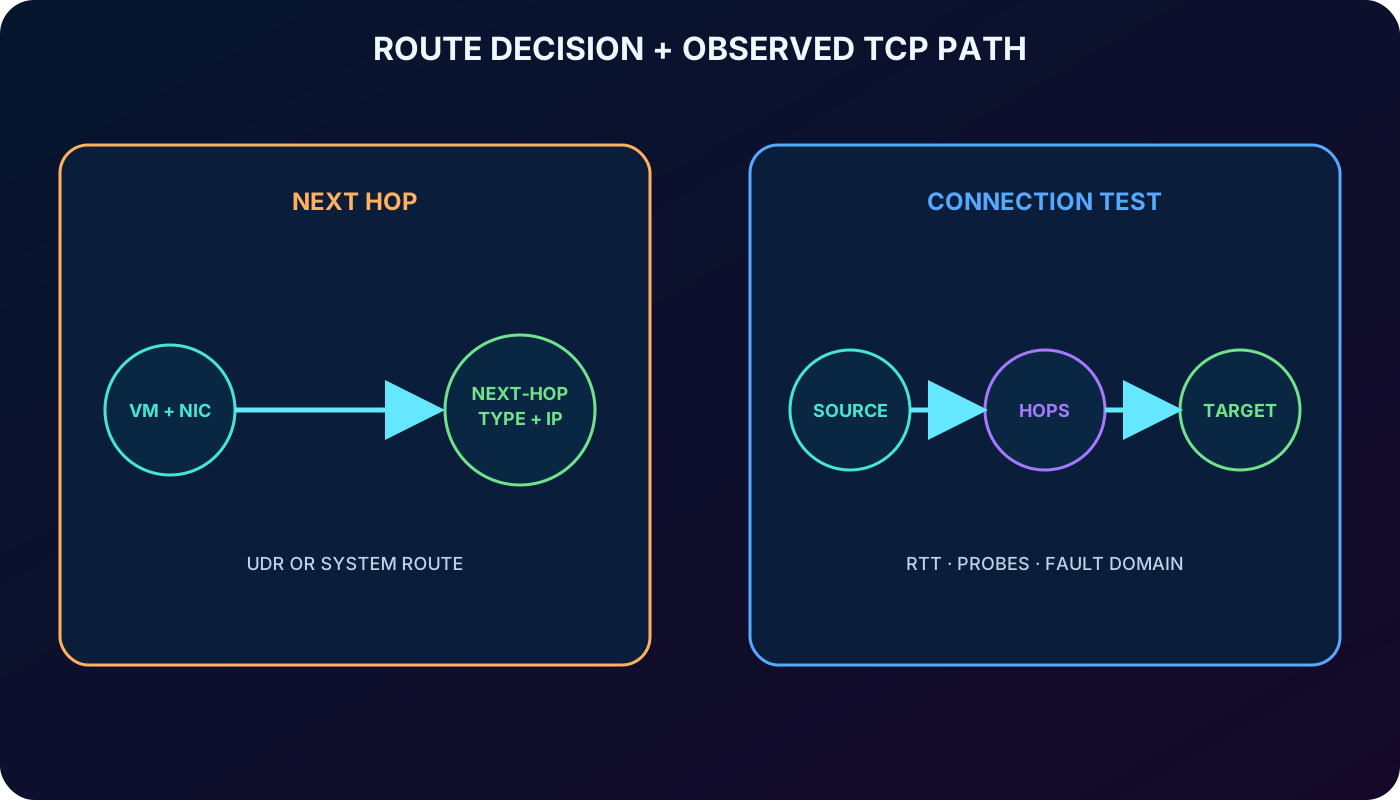
Traffic leaves a VM according to effective routes on its NIC. Next hop takes a source VM, NIC, and destination IP, then returns the next-hop type and address plus the route table ID. It helps detect traffic sent toward the wrong on-premises gateway, virtual appliance, internet path, peering, or nowhere.
If a user-defined route wins, the diagnostic returns that UDR. Otherwise it identifies the System Route. Pair this output with effective routes and NSG evidence: correct routing does not prove that filtering or the destination application is healthy.
Next hop answers the routing decision; connection troubleshoot answers the observed path result.
10. Connection troubleshoot reports latency, hops, and the likely fault domain
Connection troubleshoot tests TCP between a supported source—VM, scale set, , or Azure Bastion—and a VM, FQDN, URI, or IPv4 destination. A successful test reports latency in milliseconds, probe count, and the number of hops in the complete route.
A failed test can identify high CPU, high memory, GuestFirewall, DNSResolution, NetworkSecurityRule, or UserDefinedRoute. Treat the classification as evidence: inspect the named layer and corroborate it with guest logs, DNS, effective policy, or routes before changing production.
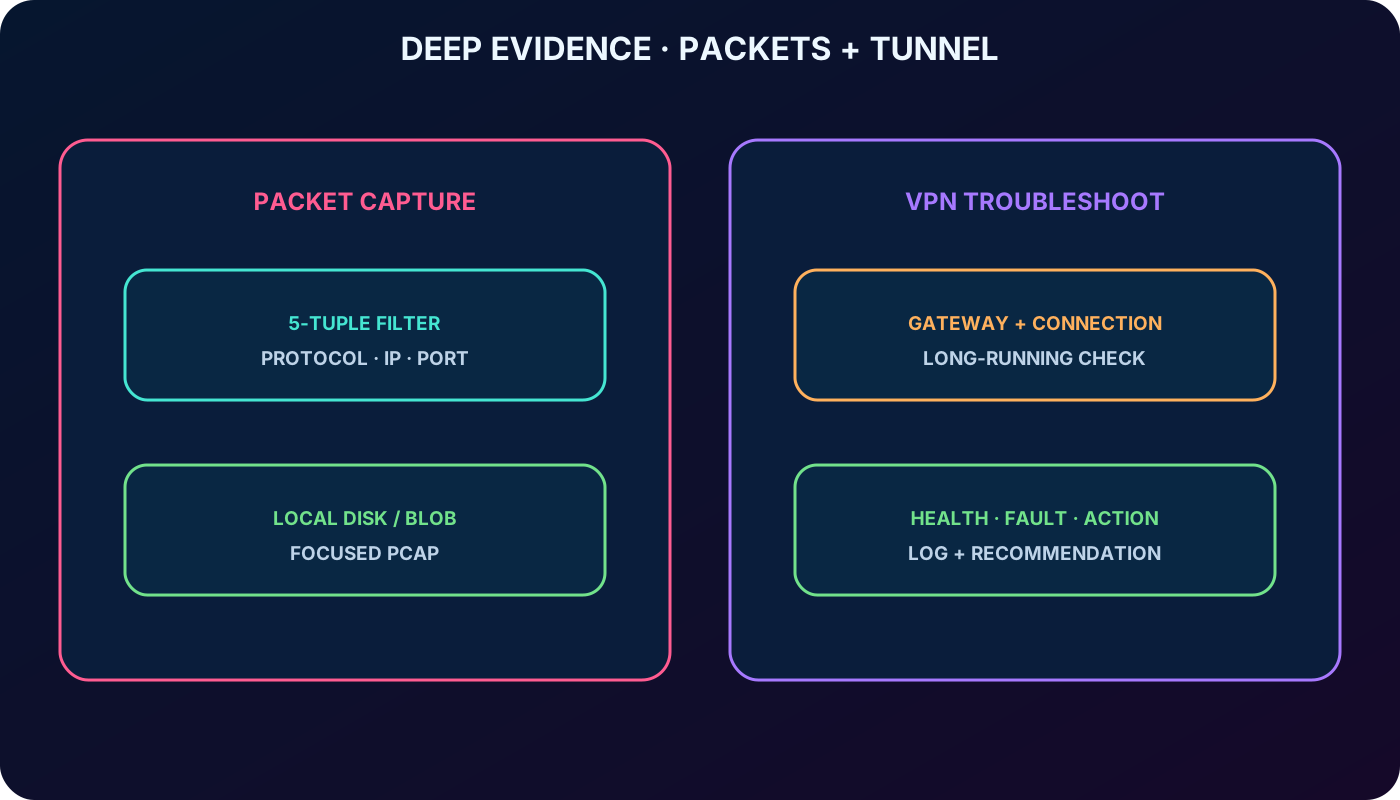
Network Watcher remotely starts packet capture on a VM or instance through the Network Watcher extension. This avoids interactive use of operating-system or third-party capture utilities on every server.
Start it from the portal, PowerShell, Azure CLI, or REST API. Filter by protocol, local/remote IP, and local/remote port so the capture remains focused. Store the result on local disk or in an Azure blob, protect the file because it may contain sensitive payloads, and stop the session as soon as enough evidence is collected.
12. VPN troubleshoot diagnoses gateways and connections as a long-running operation
VPN troubleshoot examines a virtual network gateway or connection and returns health, log information, fault details, and recommended remediation. It can be initiated through the portal, PowerShell, Azure CLI, or REST API, and only one operation can run concurrently per subscription.
Fields returned by the VPN troubleshoot API.
Field
Meaning
startTime / endTime
Diagnostic start and finish.
code
UnHealthy when at least one diagnosis fails.
results
Collection of gateway or connection findings.
id / summary / detailed
Fault type, concise summary, and full explanation.
recommendedActions
Suggested remediation actions.
actionText / actionUri / actionUriText
Instruction, documentation URI, and short documentation label.
Capture explains packets; VPN troubleshoot explains the managed gateway or tunnel.
13. VNet flow logs are the current foundation for retained traffic metadata
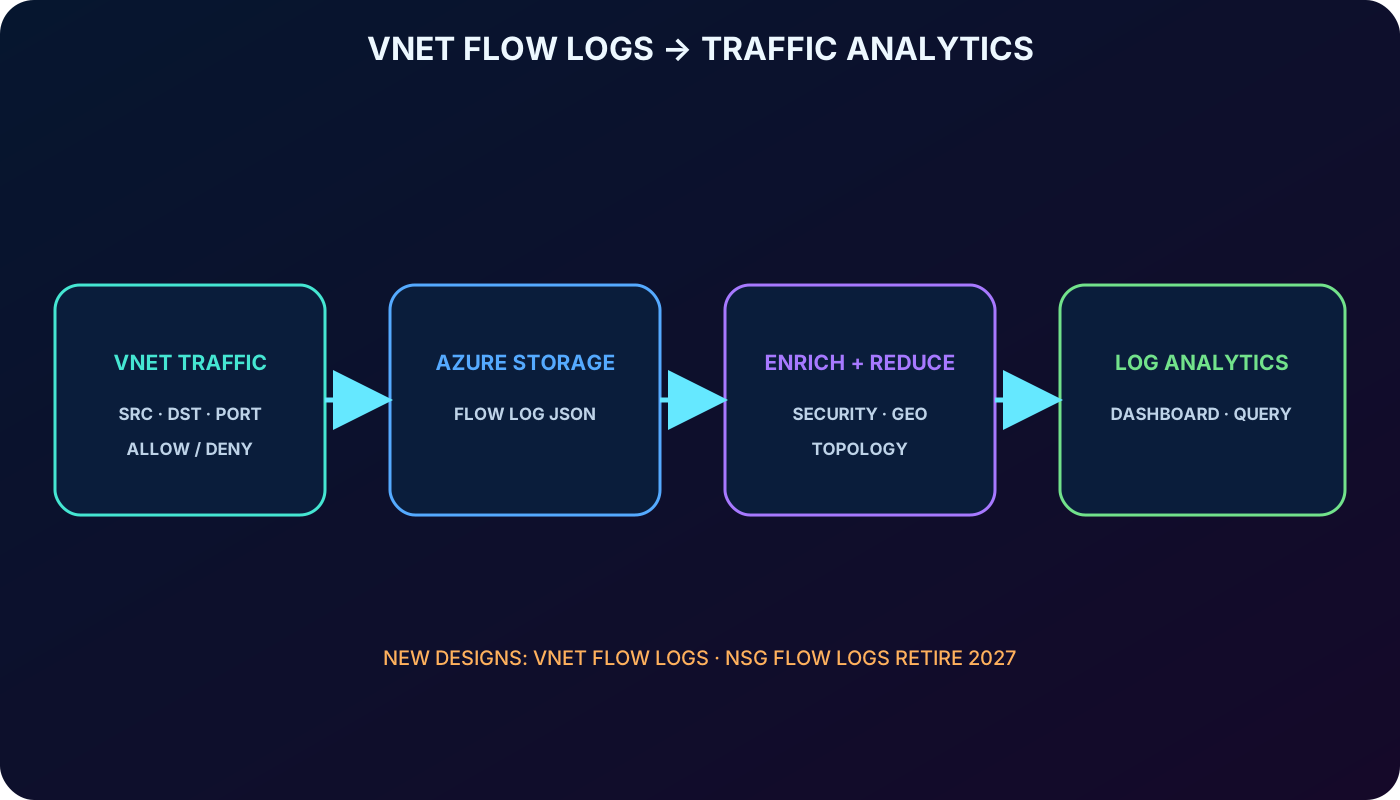
Flow logs record ingress and egress IP metadata—source, destination, ports, protocol, direction, and allow/deny outcome—and write it to Azure . They describe flows rather than full packet payloads, which makes them suitable for investigation, compliance, and traffic baselining.
The PDF says logs can target an NSG or virtual network. That historical statement now needs a migration note: no new NSG flow logs can be created after June 30, 2025, and the feature retires on September 30, 2027. Use virtual network flow logs for new designs and migrate existing NSG flow logs before retirement. Stored historical NSG records continue to follow their configured Azure retention.
14. Traffic analytics turns raw flows into operational questions
Traffic analytics aggregates common flows, enriches them with security, topology, and geography, and writes the reduced data to a Log Analytics workspace. Dashboards reveal communicating hosts, application protocols, host pairs, allowed and denied traffic, inbound and outbound flows, open internet ports, blocking rules, hot spots, and distribution across regions, VNets, subnets, and rogue networks.
Use it to spot unexpected internet exposure, suspicious destinations, capacity hot spots, or misconfigurations. Because storage, analytics ingestion, and processing can cost money, choose retention and workspace placement deliberately.
Flow logs retain network metadata; Traffic Analytics makes the metadata searchable and visual.
15. Scenario: find the NSG rule blocking remote PowerShell
A developer cannot open a remote PowerShell session from one Windows Server VM to another in the same virtual network. Use IP flow verify with the destination VM address, inbound direction, TCP, local port 5986 for PowerShell over HTTPS, and the source VM address and port. Select Check.
If the result is Deny, record the responsible rule. Confirm whether it is a NIC NSG, subnet NSG, or admin rule before changing it, add the narrowest valid higher-priority allow rule if authorized, rerun the policy test, and then test the actual PowerShell listener and guest firewall.
16. Scenario: diagnose a site-to-site VPN failure
An Azure VM is unreachable from on-premises through a new site-to-site VPN. Run VPN troubleshoot against the virtual network gateway connection from the portal, PowerShell, or Azure CLI. Review the health diagnosis, log, fault, and recommended actions.
Then separate tunnel health from workload reachability: validate local network gateway prefixes, routing, NSGs, on-premises firewall and device configuration, and finally a Connection Monitor or connection troubleshoot test across the expected path.
17. Scenario: compare regions and hybrid placement by latency
Create Connection Monitor tests so IaaS VMs in different regions regularly probe one another. Compare round-trip time and failed-check trends before deciding whether tiers should remain together or can be distributed across regions.
For a hybrid application and an Azure VM that both access the same storage endpoint, measure from both sources. Excessive on-premises latency can support migration to Azure; excessive latency from one Azure region can support moving the VM to a better region. Measure representative protocols and time windows instead of making a placement decision from one ping.
18. Do not use Network Watcher as a universal observability platform
Network Watcher provides Azure network-scenario diagnostics, not full application tracing, web analytics, synthetic browser testing, or advanced third-party packet analytics. Use application and platform capabilities, resource-specific diagnostics, Service Health, or a specialized tool when those better match the fault.
The module’s “not for PaaS” boundary describes its primary focus rather than every possible endpoint. Some Network Watcher tools can test paths involving FQDNs or supported Azure network resources, but they do not replace service-native PaaS health and application telemetry.
19. Use a layered troubleshooting sequence
Scope the incident by subscription, region, VNet, subnet, endpoint, direction, protocol, and time.
Use Topology to enumerate every resource and relationship in the path.
Check Connection Monitor trends or run connection troubleshoot for an immediate test.
Evaluate filtering with IP flow verify, NSG diagnostics, and effective security rules.
Evaluate routing with next hop and effective routes.
Inspect DNS, guest firewall, CPU, memory, listener, and application state.
Use packet capture only when higher-level evidence does not explain the protocol behavior.
Use VPN troubleshoot for the managed gateway or connection.
Use VNet flow logs and Traffic Analytics for historical patterns and security context.
Record evidence before remediation, make the smallest authorized change, then repeat the same test.
20. Assessment answers map directly to the tool time model
Correct assessment responses.
Question
Answer
Reason
Which resources connect to a Dev/Test virtual network?
Topology
It visualizes resources and their relationships.
Did an NSG change affect VM-to-VM connectivity?
Connection Monitor
It continuously detects reachability and configuration-related changes.
Can on-premises devices communicate through the new VPN?
VPN troubleshoot
It diagnoses the gateway and connection and recommends actions.
21. Compact version of every topic
Fast revision.
Topic
Remember
Scope
Network Watcher is regional network evidence, mainly for Azure VNet and IaaS scenarios.
Topology
Map resources and relationships before choosing a diagnostic.
Connection Monitor
Continuous Azure/hybrid tests, trends, path, logs, metrics, and alerts.
Security
IP flow verify tests one tuple; NSG diagnostics tests broader targets; effective rules aggregates policy.
Routing
Next hop returns the winning next-hop type, address, and route source.
Connection troubleshoot
One-time TCP test with latency, hops, and fault classification.
Packet/VPN
Capture protocol evidence; diagnose managed tunnel health separately.
Traffic
Use VNet flow logs for new designs and Traffic Analytics for enriched views.
Boundary
Use service health, , application telemetry, or third-party tools outside its scope.
22. Active recall and official resources
Active-recall prompts
Classify every tool as continuous monitoring, point diagnostic, or traffic evidence.
Explain why Allow from IP flow verify does not prove that the application works.
Compare IP flow verify, NSG diagnostics, and effective security rules.
Compare Connection Monitor with connection troubleshoot.
Reconstruct the VPN troubleshoot result fields.
Explain why new deployments use VNet flow logs instead of NSG flow logs.
Design the diagnostic order for a failed hybrid TCP connection.