Collect host and guest telemetry, build useful metric views, enable alerts and enhanced monitoring, route logs with data collection rules, and investigate Linux Syslog with KQL.
Suggested study time: 100 minutes • Intermediate • Original rewrite based on the supplied Microsoft Learn module and checked against current Azure Monitor documentation
By João Ricardo Dutra••Complete original content
1. Turn a busy VM workload into an observable service
Imagine an online ticketing and tour-information service running on Azure virtual machines. Traffic changes rapidly, releases are frequent, and the site must remain responsive without paying for permanently oversized machines. The administrator needs evidence about availability, CPU, memory, disks, network traffic, operating-system events, and application behavior before a user reports a problem.
brings those signals together for Azure and non-Azure environments. In this chapter you will distinguish metrics from logs, inspect host telemetry, enable useful alerts and boot diagnostics, analyze charts, collect guest data with Agent, define data collection rules, and query Linux events. Familiarity with virtualization, the Azure portal, and VM creation is assumed. Labs require a subscription and Contributor-level access at the working scope.
Decide which host, guest operating-system, workload, and application signals to collect.
Use recommended alert rules, Activity Log, diagnostic settings, and boot diagnostics.
Analyze platform metrics in Metrics Explorer and guest performance through the current enhanced-monitoring experiences.
Install Agent, associate data collection rules, and send Syslog to a Log Analytics workspace.
Use Kusto Query Language (KQL) to isolate events that explain a performance or reliability symptom.
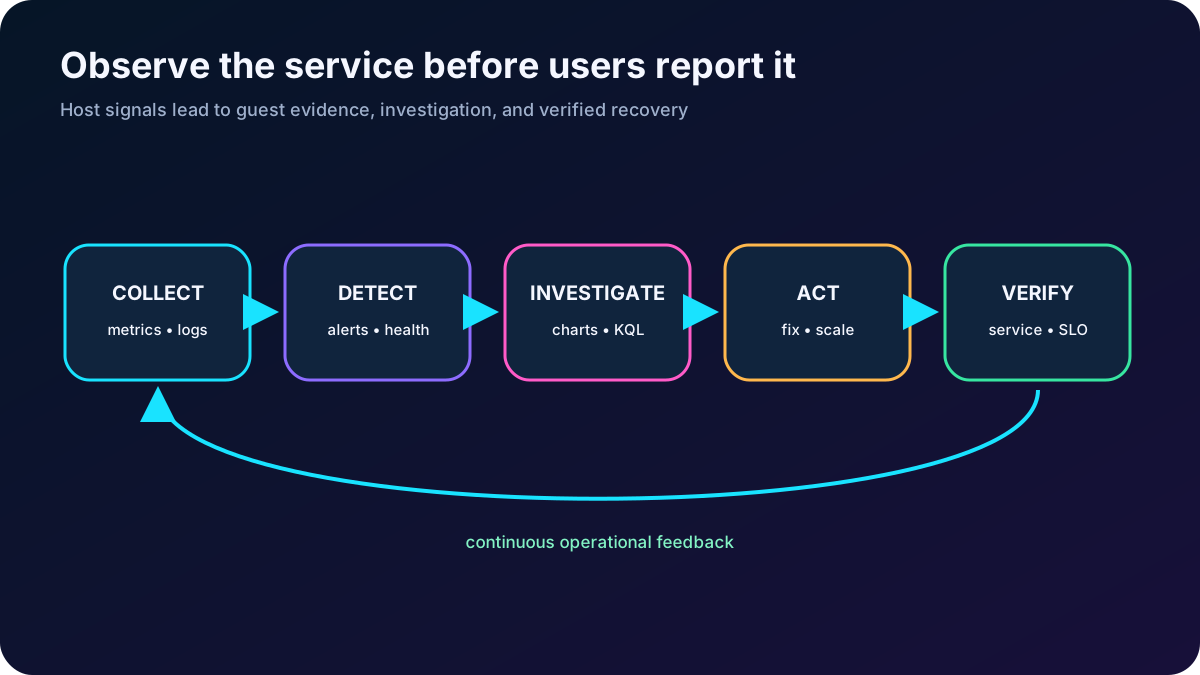
Monitoring is a feedback loop: collect, detect, investigate, act, and verify.
2. Separate Metrics from Logs
The two foundations of the data platform.
Characteristic
Metrics
Logs
Shape
Numeric time-series values sampled at regular intervals.
Timestamped structured records or free-form events.
Best use
Fast charts, near-real-time thresholds, trends, and dimensions.
Investigation, correlation, flexible schemas, long analysis, and KQL.
VM default
A baseline of platform/host metrics is collected automatically and without configuration.
Azure Activity Log is automatic; guest logs require explicit collection.
metrics database; platform and custom metrics are normally retained for 93 days.
A Log Analytics workspace when Logs collection is configured; retention follows workspace/table settings.
Typical examples
Percentage CPU, disk I/O, network flows, VM availability.
Resource changes, Windows events, Linux Syslog, IIS or custom application logs.
Metric history can also be routed to Logs for longer analysis. Metrics Explorer displays at most a 30-day interval on one chart even though retained platform metrics can be panned across the 93-day window. Logs incur ingestion and retention costs according to their destination and configuration, so collect with intent.
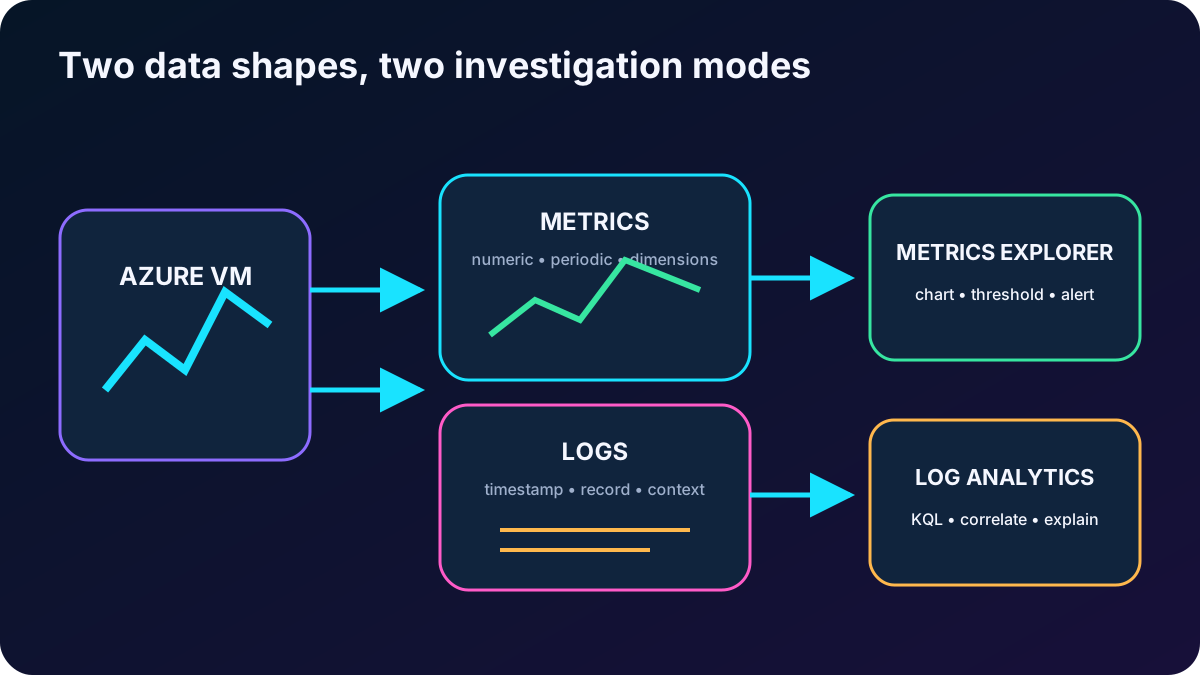
Metrics tell you that behavior changed; logs often explain why.
3. Monitor all four layers of a virtual machine
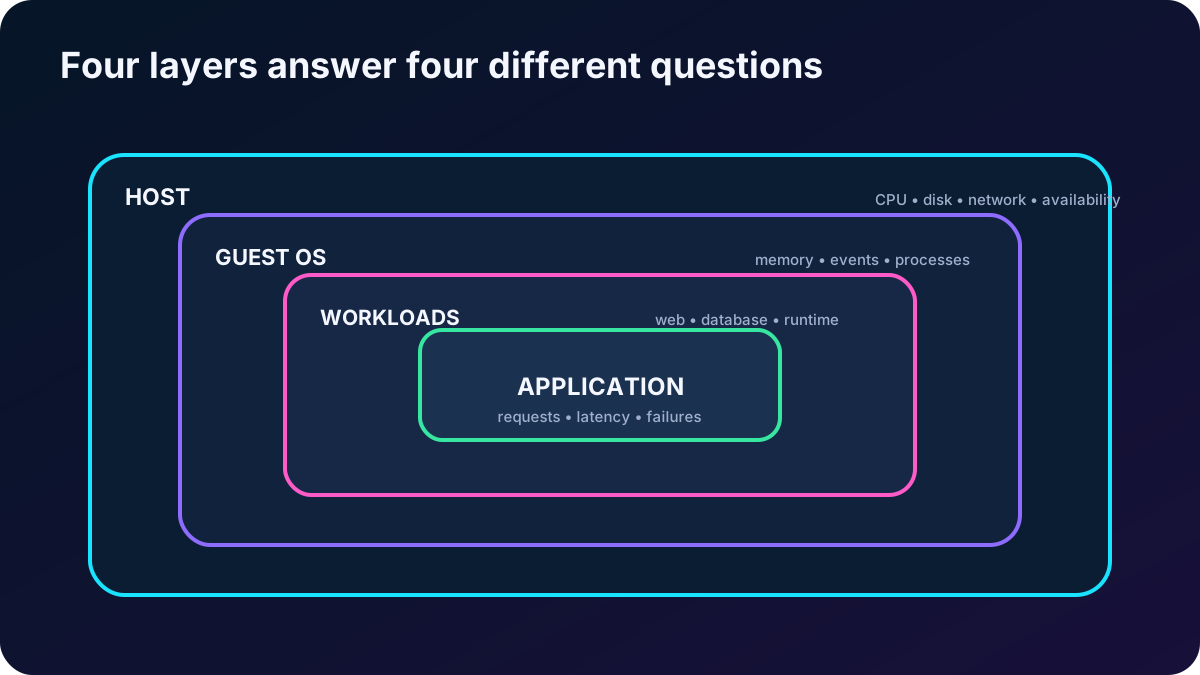
Each layer answers a different operational question.
Layer
What it represents
Representative telemetry
Virtual machine host
Azure compute, storage, and network resources allocated to the VM.
Availability, CPU, disk throughput and operations, network traffic, and control-plane activity.
Guest operating system
Windows or Linux running inside the VM.
Memory, processes, services, file systems, performance counters, Windows events, and Syslog.
Workloads
Web servers, databases, runtimes, and other software hosted by the guest.
Workload counters, process resource use, dependencies, and workload-specific events.
Application
The business service that spans one or more machines and dependencies.
Requests, failures, latency, traces, dependencies, and user impact, commonly through Application Insights.
Start with automatic host data to find the affected machine, then move into guest, workload, and application telemetry for root cause. Host data alone cannot report free memory inside the operating system or explain which process consumed CPU.
A complete investigation moves from infrastructure symptoms toward the workload that caused them.
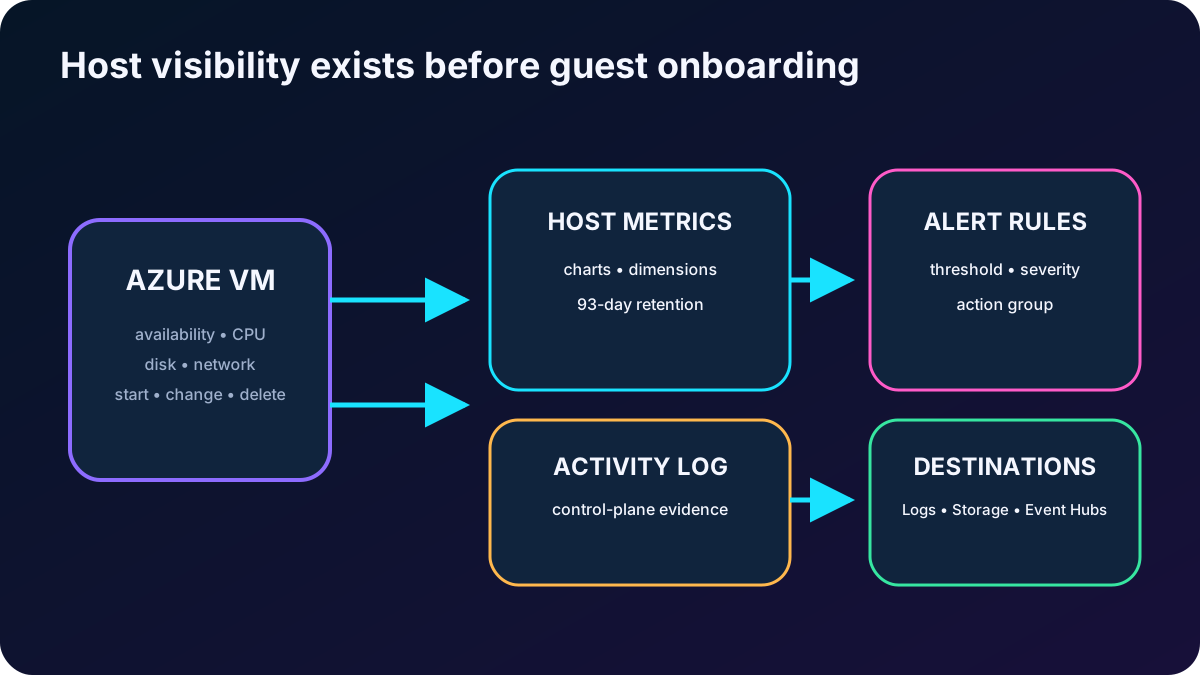
4. Use host metrics, recommended alerts, and the Activity Log
Every Azure VM exposes a baseline on its Overview and Monitoring surfaces. Common tiles include VM availability, average CPU percentage, total operating-system disk bytes, total network traffic, and average disk operations per second. The exact set and names depend on VM type and portal evolution.
Three host-level monitoring controls.
Control
Purpose
Exam cue
Recommended alert rules
Create a starter set for availability and common host CPU, network, and disk conditions, with thresholds, severities, and an action group.
Enable during VM creation or later from Monitoring/Alerts; tune the generated rules instead of treating defaults as a finished enterprise design.
Azure Activity Log
Records subscription control-plane operations such as start, stop, create, update, and delete.
It is collected automatically; filter at VM or subscription scope and export when longer retention or correlation is required.
Diagnostic settings
Route supported platform logs and metrics to one or more destinations.
Choose the destination by operational purpose, not by habit.
Diagnostic destination choices.
Destination
Choose it for
Log Analytics workspace
KQL queries, correlations, dashboards, and metric or log search alerts.
Azure
Low-cost archive, audit retention, or downstream batch processing.
Streaming telemetry to a SIEM or another consumer outside .
Current recommended alerts based on host metrics should not be duplicated with equivalent OpenTelemetry recommended alerts, or administrators may receive two notifications for the same incident. Also account for alert-rule, dimension, evaluation-frequency, ingestion, and retention costs.
Host telemetry gives immediate coverage before an agent is installed.
5. Diagnose startup failures with boot diagnostics
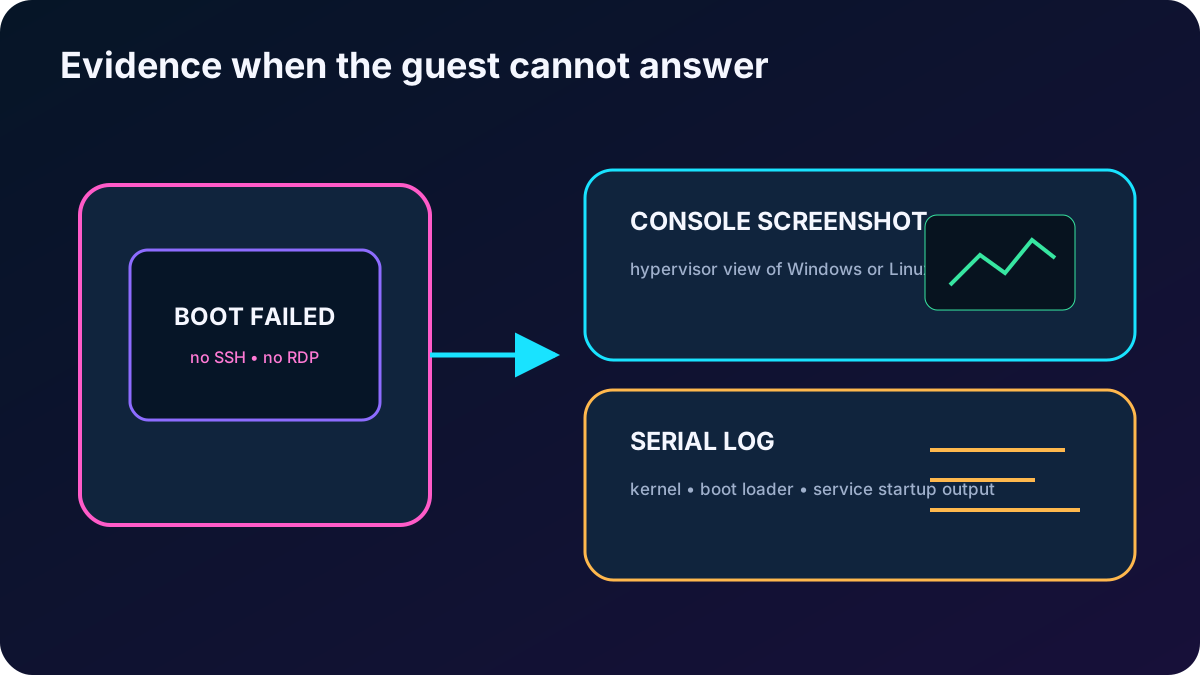
Boot diagnostics captures evidence from the hypervisor while a VM starts. A screenshot shows the current console state for Windows or Linux, and the serial log exposes boot output, which is especially useful on Linux. Managed boot diagnostics stores the artifacts in a Microsoft-managed storage account and is the simplest default; a custom storage account is used only when its governance requirements justify the added management.
Boot diagnostics is not the same as guest monitoring. It helps when the operating system cannot start or accept a connection, while Agent observes a running guest. Legacy Linux and Windows diagnostic extensions appear in historical labs, but new designs should use Agent and data collection rules for guest telemetry.
Boot diagnostics remains useful precisely when normal in-guest tools are unavailable.
6. Lab: create a monitored Linux VM and verify host data
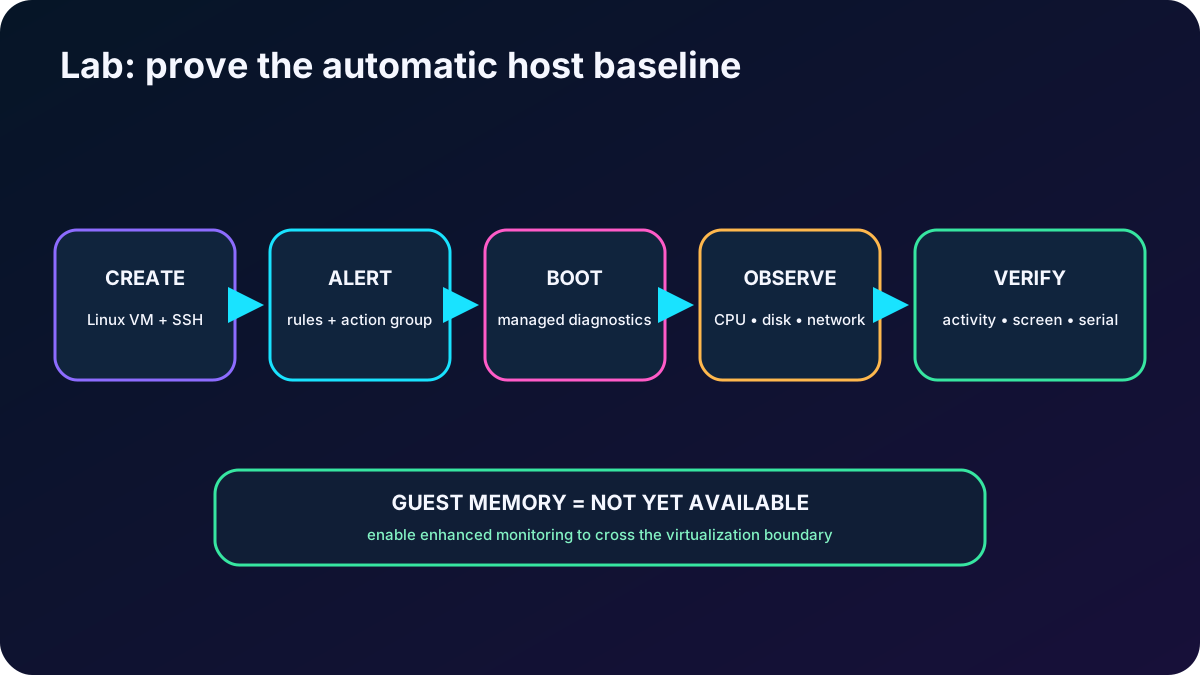
The supplied exercise creates a Linux VM, turns on recommended alerts, and checks host evidence. Use a currently supported Ubuntu LTS image instead of pinning the historical image in the export. Names below are examples and the VM creates billable compute, disk, networking, monitoring, and alert resources.
Create resource group rg-az104-monitor-lab and Linux VM vm-monitor-lab in the same region. Use SSH keys, least-privilege inbound access, and a supported Ubuntu LTS image.
On the Monitoring step, enable recommended alert rules. Review every selected signal, threshold, severity, and evaluation window; attach an action group with an email recipient or another tested notification channel.
Enable managed boot diagnostics. Do not enable a legacy guest diagnostics extension as a substitute for Agent.
Create the VM, securely download or retain the SSH private key, and wait for deployment to complete.
Open the VM monitoring overview and verify availability, CPU, disk bytes, network totals, and disk operations. Guest available memory should still be absent until enhanced guest monitoring is enabled.
Open Activity Log and confirm the deployment/start operations. Then inspect Boot diagnostics > Screenshot and Serial log.
The same information can be retrieved or automated with Azure CLI, Azure PowerShell, ARM/Bicep, policy, and APIs. The portal exercise exists to make the relationships visible.
Before installing an agent, prove which host signals Azure already supplies.
7. Build meaningful charts in Metrics Explorer
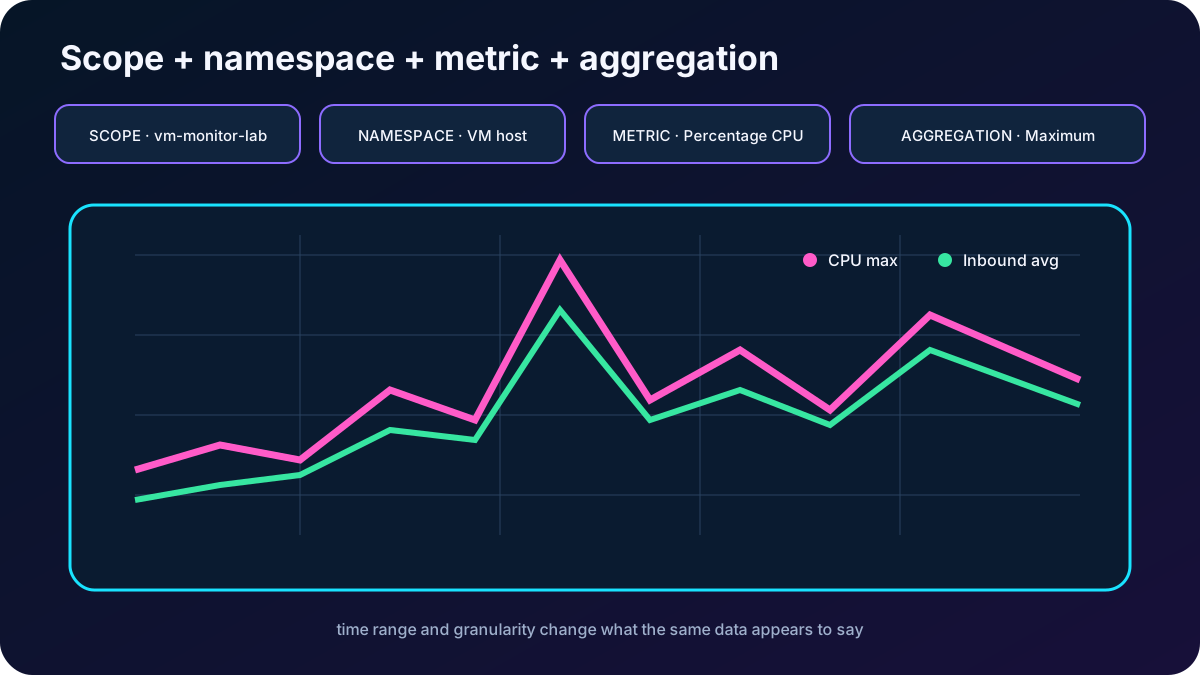
Metrics Explorer lets an administrator select a scope, metric namespace, metric, and aggregation. Scope can include additional resources of the same supported type and region. A namespace groups metric definitions; services such as expose separate namespaces for blobs, files, queues, and tables. Aggregation converts samples within each time grain into count, average, maximum, minimum, or sum.
Controls that change a chart.
Control
Effect
Scope
Chooses the resource or compatible resource set.
Metric namespace
Chooses the provider category that owns the metric.
Metric
Chooses the measured signal, such as Percentage CPU or Inbound Flows.
Aggregation
Chooses how samples are rolled up inside each time grain.
Time range and granularity
Choose the analysis window and bucket size; these are chart controls, not part of the four metric selectors above.
Dimensions/splitting
Break one metric into series by a supported property such as instance or direction.
Charts can combine metrics, split series, compare resources, change colors and axes, and be pinned or reused in dashboards and workbooks. Match granularity to the question: a one-minute maximum can reveal a short spike that a one-hour average hides.
A chart is only meaningful when scope, aggregation, and time grain match the hypothesis.
8. Lab: compare CPU with inbound traffic
Open the VM, select Monitoring > Metrics, or open > Metrics and choose the VM as scope.
Select the virtual-machine host metric namespace, Percentage CPU, and Maximum aggregation.
Set a recent analysis window such as the last 30 minutes and choose a fine time granularity.
Select Add metric; choose Inbound Flows and Average aggregation so both series share the chart.
Generate safe test traffic if the lab allows it, then look for correlation. Correlation is evidence for investigation, not proof of causation.
Save, pin, or export the chart when it belongs in an operational view.
For the source knowledge check, Add metric is the command that places a second signal on the same chart. Time range is not one of the selector fields that define a metric; namespace and aggregation are.
9. Collect guest telemetry with Agent and DCRs
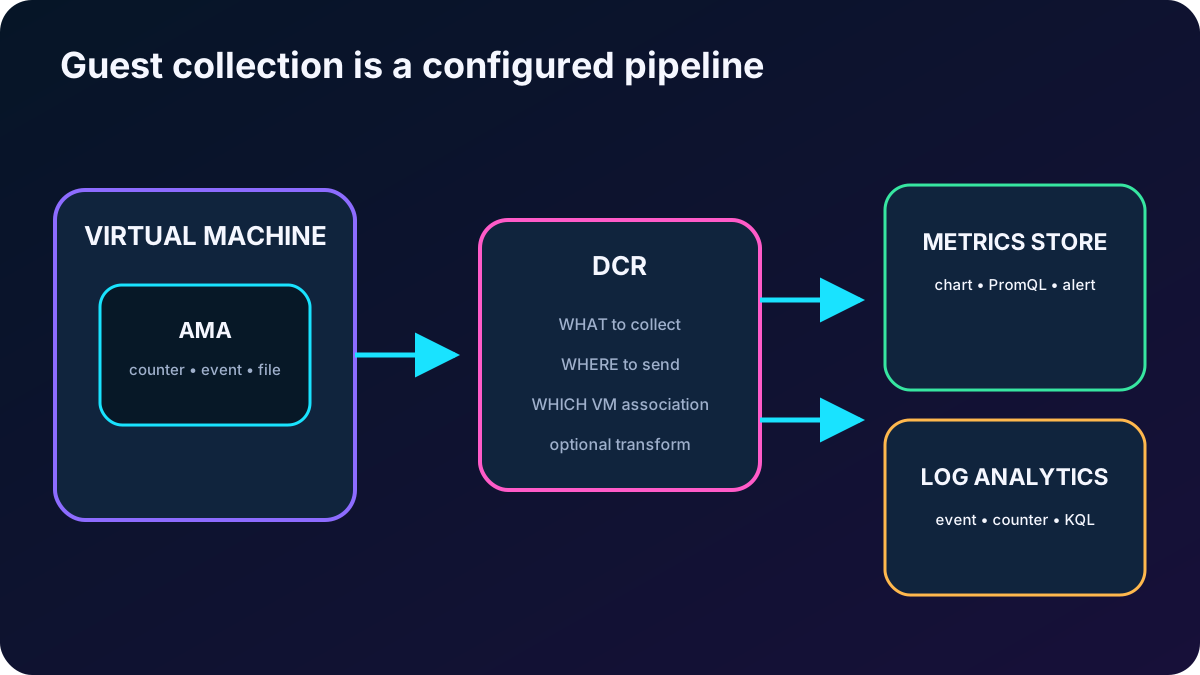
Host monitoring stops at the virtualization boundary. To collect memory, processes, performance counters, Windows Event Logs, Syslog, or application files inside a VM, install Agent (AMA), define one or more data collection rules (DCRs), and associate those rules with the machine.
AMA runs in the guest and can be installed directly, by VM extension, at scale with , or indirectly when a monitoring feature is enabled.
A DCR states which data sources to collect, any supported transformation, and the destination. One agent can follow several DCRs, and one DCR can target many compatible machines.
Guest performance data can be sent to Metrics or Logs depending on the selected experience and DCR. Guest events are sent to a Log Analytics workspace for KQL analysis.
The DCR-to-VM association is what tells the agent to download a rule. Removing the association stops that rule from collecting from the machine.
A data collection endpoint (DCE) is not mandatory for ordinary public-endpoint AMA collection. Use one when the source or networking design requires it, especially Private Link scenarios.
Agent, rule, association, and destination are four separate pieces of the guest collection path.
10. Understand current enhanced monitoring and VM insights
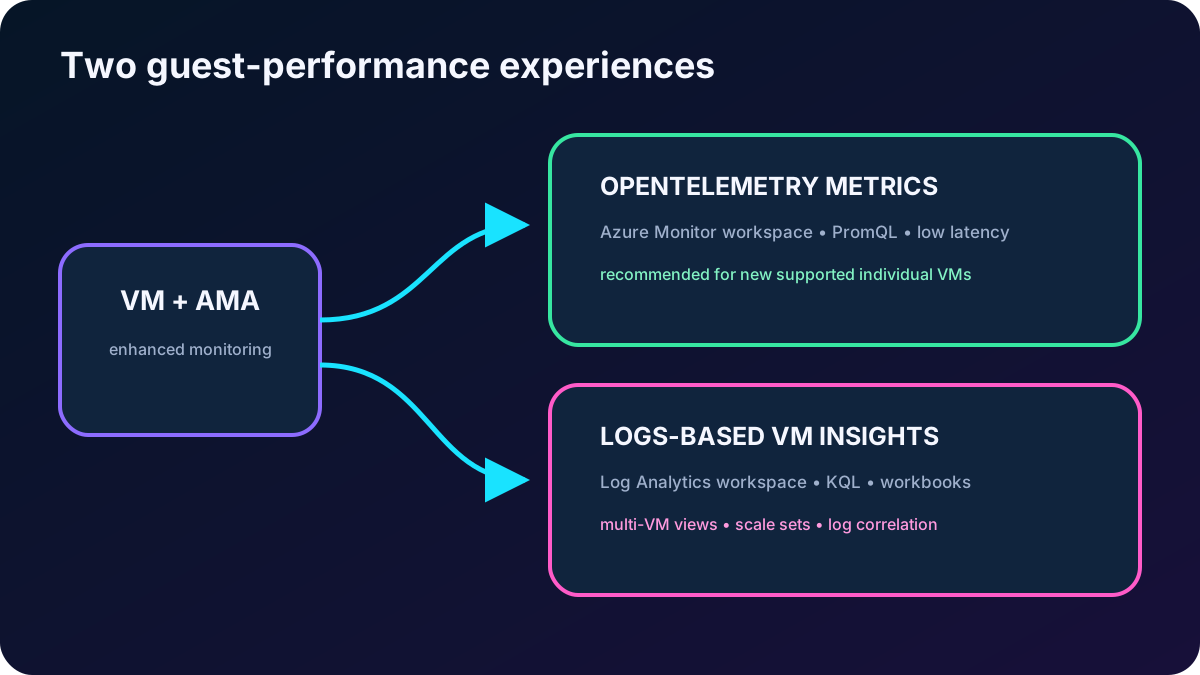
The historical module uses VM insights as the shortest path to install AMA, create a preconfigured DCR, collect common Windows and Linux counters into a Log Analytics workspace, and display trending performance charts and workbooks. That logs-based experience remains useful when you need KQL correlation or built-in multi-VM views.
For new individual VMs and -enabled servers, the current portal recommends OpenTelemetry metrics-based enhanced monitoring. It sends standardized guest system metrics to an workspace, uses PromQL, has lower latency, and includes a free default metric set. Logs-based monitoring stores platform-specific counters in Log Analytics, uses KQL, supports VM scale sets and richer built-in multi-VM workbooks, and incurs normal log ingestion/retention costs. Both can be enabled when their distinct value justifies the cost and duplicate signal management.
Choose the guest performance experience intentionally.
Need
Prefer
New VM, standardized near-real-time guest system metrics and PromQL
OpenTelemetry metrics-based enhanced monitoring.
VM scale sets, built-in multi-VM trending, or direct metric/log correlation in one KQL workspace
Logs-based VM insights experience.
Operating-system and application events
Custom DCR to Log Analytics, regardless of the performance experience.
Application requests, traces, failures, and dependencies
The former VM insights Map and Dependency Agent are deprecated and retire on June 30, 2028; new VMs can no longer be onboarded through the portal. Learn its historical purpose—showing process groups and network dependencies—but do not enable it for a new design. Use current Application Insights application maps and supported dependency instrumentation where appropriate.
Current Azure offers two guest-performance experiences with different stores, query languages, scale, and cost.
11. Lab: enable guest performance monitoring
Open the VM Monitor page and choose Configure or Enable enhanced monitoring.
Keep OpenTelemetry metrics selected for a new supported VM. Optionally enable logs-based metrics when you need VM insights workbooks or KQL correlation.
Review the selected workspace and/or Log Analytics workspace, the generated DCR, performance-counter set, managed identity, and recommended alerts.
Save the configuration. AMA installation and data arrival are asynchronous; allow several minutes, then verify the AzureMonitorLinuxAgent or AzureMonitorWindowsAgent extension.
Return to Monitor/Insights and inspect CPU, memory, disks, and network from the guest. Change the time range and per-chart aggregation; open the workbook gallery and customize a copy if needed.
Do not search for logs-based VM insights counters in the platform Metrics Explorer unless the DCR also routes the required guest metrics to the metrics store.
The source lab estimates roughly five to ten minutes for agent/workspace configuration and another five to ten for data. Treat those numbers as expectations, not an SLA; verify extension health, DCR association, network reachability, and destination permissions when data remains absent.
12. Design custom rules for counters and events
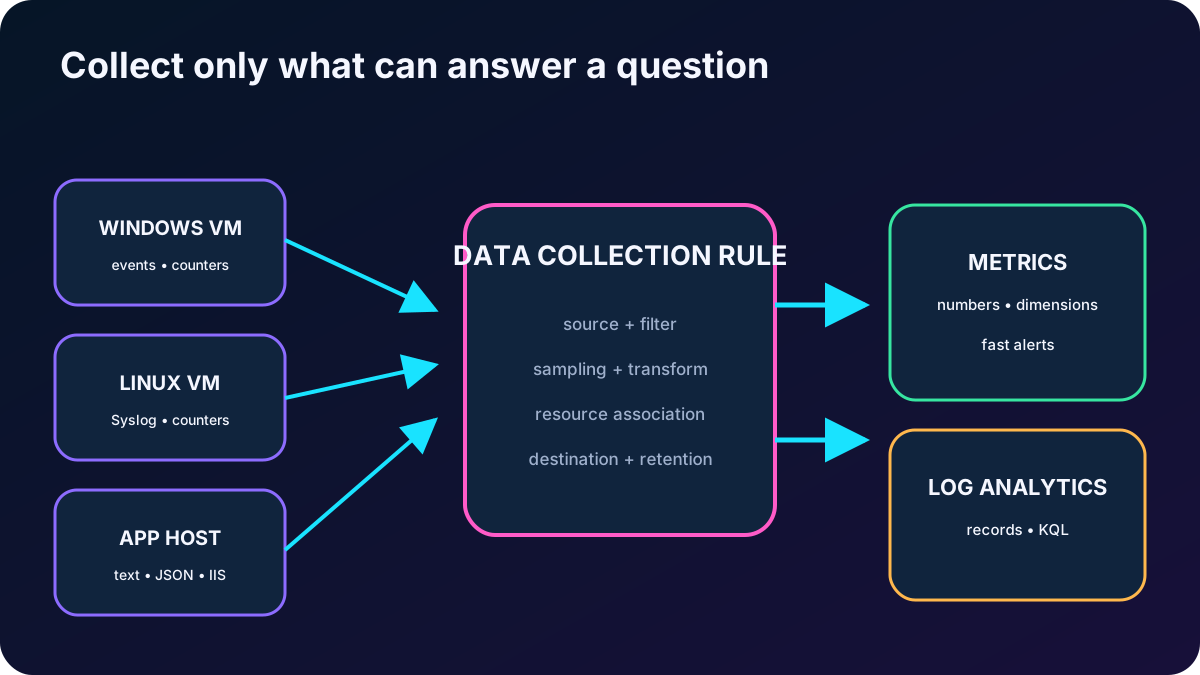
A preconfigured monitoring experience is a baseline, not a limit. Create custom DCRs for extra performance counters, sampling intervals, Windows event channels, Linux Syslog facilities/severities, IIS logs, firewall logs, custom text or JSON, and other supported sources. A broad common rule improves consistency; separate rules are appropriate when operating systems, teams, destinations, compliance, or cost controls differ.
DCR design checklist.
Decision
Question to answer
Source and filter
Which counter, log channel, facility, severity, or file is necessary? Filter before ingestion when possible.
Frequency
How quickly must the signal reveal a problem, and what volume will that sampling create?
Destination
Metrics for fast numeric analysis, or Log Analytics for records and KQL?
Scope
Which VMs share this rule, and is every association intentional?
Endpoint
Can public endpoints be used, or does Private Link/source type require a DCE?
Cost and retention
What ingestion, query, alert, archive, and retention charges result?
Collect the smallest reliable signal set that can answer an operational question.
13. Lab: send Linux Syslog to Log Analytics and query it
Create a DCR in the same region as the target Log Analytics workspace. Select Linux as the platform and associate vm-monitor-lab on the Resources tab.
Create or choose a DCE only if the networking/source scenario requires it. The supplied historical exercise explicitly creates linux-logs-endpoint; ordinary public AMA collection now uses service/DCR endpoints without a dedicated DCE.
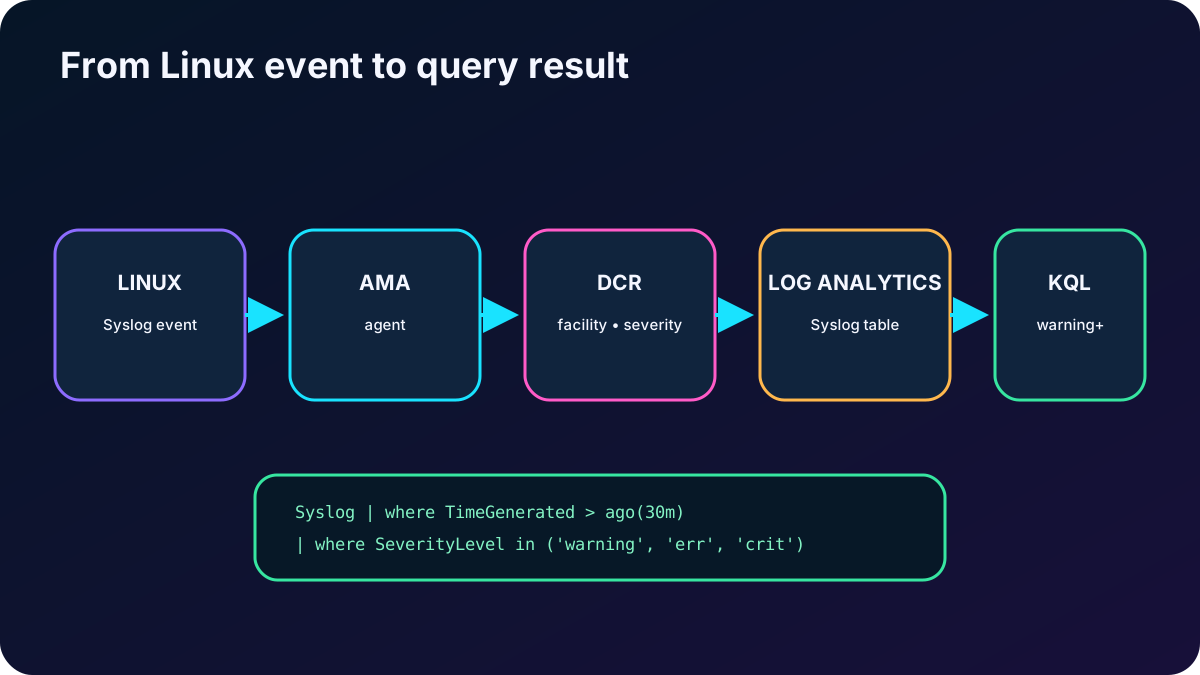
On Collect and deliver, add Linux Syslog. Select only the required facilities and minimum severity. Warning includes Warning and every more severe level; NONE disables a facility.
Choose the Log Analytics workspace as destination, review the data flow, and create the rule. Confirm the VM association and AMA health.
Open Logs from the VM or workspace. Start with the Syslog table, then constrain time, computer, facility, severity, and message.
Generate a harmless test event if necessary, allow for ingestion latency, and confirm that the query returns the expected record.
Syslog
| where TimeGenerated > ago(30m)
| where SeverityLevel in ('warning', 'err', 'crit', 'alert', 'emerg')
| project TimeGenerated, Computer, Facility, SeverityLevel, SyslogMessage
| order by TimeGenerated desc
Metrics and counters show that a threshold or pattern changed; event logs provide the details needed to identify the responsible service, configuration, or failure. For the source check, collecting guest event logs requires a DCR, and viewing them requires a KQL query against the destination Log Analytics workspace.
The query closes the path from collection configuration to actionable evidence.
14. Explain the knowledge-check answers
Questions and reasoning.
Question
Correct answer
Reason
What are the two core data types?
Metrics and logs.
Metrics are numeric time series; logs are timestamped records analyzed with queries.
Which four VM layers require monitoring?
Host, guest operating system, workloads, and application.
Each exposes different symptoms and requires different telemetry.
Where do you enable the supplied VM alerts while creating a VM?
The Monitoring configuration and its recommended-alert option.
The wizard can create and connect the baseline rules and action group.
Which signal is not available as an automatic host metric?
Guest OS available memory.
The host cannot inspect memory accounting inside the guest; enhanced monitoring is required.
How do you add another series in Metrics Explorer?
Add metric.
It selects a second metric and aggregation for the same chart.
Which choice is not one of the four metric selectors?
Time range.
It changes the chart window; scope, namespace, metric, and aggregation define the selected metric.
What does VM insights provide in the historical module?
Simplified AMA onboarding, a common counter DCR, guest metrics, and prebuilt performance workbooks.
It accelerates logs-based guest monitoring.
What is the quickest historical route to install AMA for this lab?
Enable VM insights/enhanced monitoring.
The portal performs agent, workspace, DCR, and association steps.
How are guest events collected and viewed?
A DCR sends them to Log Analytics, and KQL reads the destination tables.
Agent installation alone does not define source, filter, or destination.
15. Compact review of every topic
Short versions for active recall.
Topic
Remember this
Goal
Observe availability and performance early enough to protect user experience and control cost.
Data types
Metrics are numeric time series; logs are timestamped records.
Alert evaluations, log ingestion, retention, and overly broad collection all matter.
16. Practice, cleanup, and current resources
Create one host-metric alert and one log-search alert, then document the signal, threshold/query, action group, owner, and expected response.
Compare a one-minute maximum with a one-hour average for the same CPU spike and explain why the conclusions differ.
Associate one Syslog DCR with two Linux VMs, then remove one association and verify collection stops only for that machine.
When finished, delete rg-az104-monitor-lab to remove the VM, disks, IPs, alert rules, DCR associations, and lab-only monitoring resources. Preserve shared workspaces or action groups that were not created exclusively for this lab.