Suggested study time: 78 minutes • Intermediate • Complete original rewrite with a concise summary for every topic
By João Ricardo Dutra••Complete original content
1. Monitoring must cover the complete application stack
A cloud architecture is not observable merely because individual resources expose dashboards. The monitoring design must correlate infrastructure, platform services, application behavior, availability, and user experience so that teams can identify degradation before it becomes a prolonged outage.
The Tailwind Traders scenario combines IaaS and PaaS workloads after earlier incidents took too long to detect and resolve. Its target state is continuous, full-stack monitoring with useful insights, proactive alerts, and analysis of platform metrics and logs.
Topic summary
Full-stack monitoring connects resource health, application performance, availability, and user experience to shorten detection and recovery time.
2. is the common observability data platform
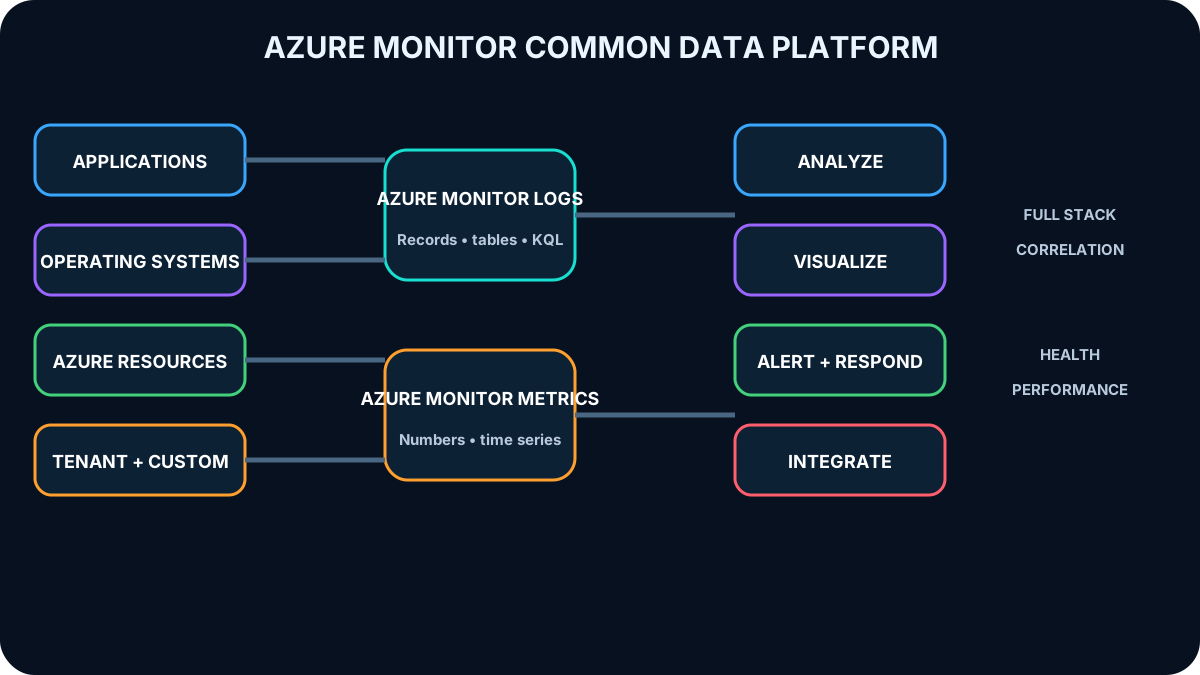
gathers telemetry from applications, operating systems, Azure resources, subscriptions, tenants, and custom sources. A shared data platform allows teams to examine many resources with a common set of query, visualization, alerting, and automation tools.
centralizes heterogeneous telemetry and exposes it to analysis, visualization, alerting, and downstream integrations.
Topic summary
supplies one platform for collecting and analyzing telemetry across application and infrastructure layers.
3. Logs and Metrics optimize different monitoring questions
Two primary data stores.
Component
Data model
Best suited to
Logs
Records organized into tables
Complex investigation, correlation, filtering, joins, aggregation, and historical analysis
Metrics
Numerical time-series values collected at intervals
Near-real-time health, trends, dashboards, threshold alerts, and rapid response
The same incident often needs both. A metric can reveal that latency crossed a threshold, while logs explain which request, dependency, identity, or configuration contributed to the problem.
Topic summary
Metrics quickly show that behavior changed; logs provide the detailed context needed to understand why.
4. Organize data sources by application and platform layers
The highest monitoring layer represents the application and its business transactions. Lower layers include the guest operating system, Azure resource, subscription, and tenant control plane. The design should capture enough telemetry at each layer to trace a user-visible symptom to its technical cause without collecting indiscriminately.
Topic summary
A layered source model connects application symptoms to operating-system, resource, subscription, and tenant events.
5. Data Collection Rules make collection explicit and reusable
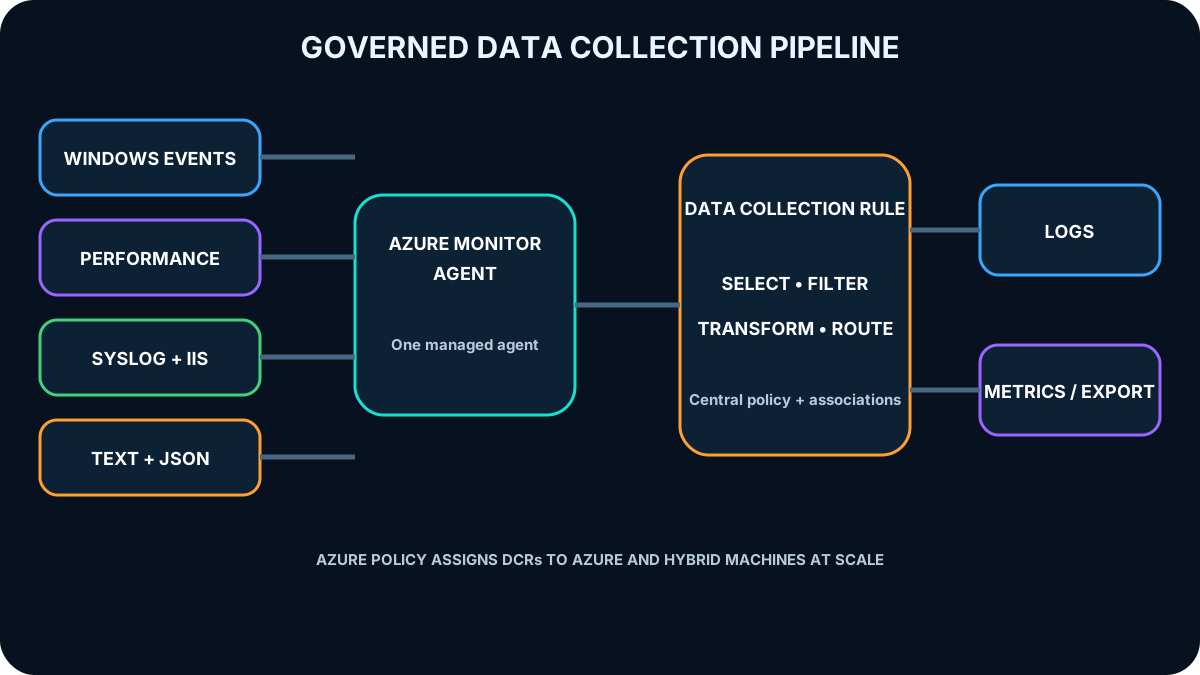
Data Collection Rules (DCRs) define which telemetry is collected, how it is filtered or transformed, and where it is sent. Rules are created centrally and attached to resources through data collection rule associations, which separates collection policy from individual machine configuration.
can deploy and associate DCRs at scale, reducing configuration drift across Azure virtual machines and hybrid machines.
A DCR is the governed collection contract between telemetry sources, transformations, and destinations.
Topic summary
DCRs centralize source selection, transformation, routing, and assignment so telemetry collection can be governed at scale.
6. Agent collects operating-system and workload data
Windows events, including events produced by tools such as Sysmon.
Performance counters that quantify operating-system and workload behavior.
Syslog messages produced by Linux systems and services.
IIS logs read from local storage on Windows machines.
Custom text and JSON files whose target table schema is described by the DCR.
Topic summary
Agent uses DCRs to collect Windows, Linux, IIS, performance, and custom file telemetry through one managed pipeline.
7. KQL turns log records into operational evidence
Kusto Query Language (KQL) queries Logs tables. Filtering narrows events, aggregation summarizes behavior, joins correlate sources, and time-series operators expose trends and anomalies. Queries remain read-only and can become the analytical basis for investigations, Workbooks, and log alerts.
Topic summary
KQL converts collected records into correlations, trends, anomaly evidence, reports, and alert conditions.
8. Alerts need detection, routing, and processing layers
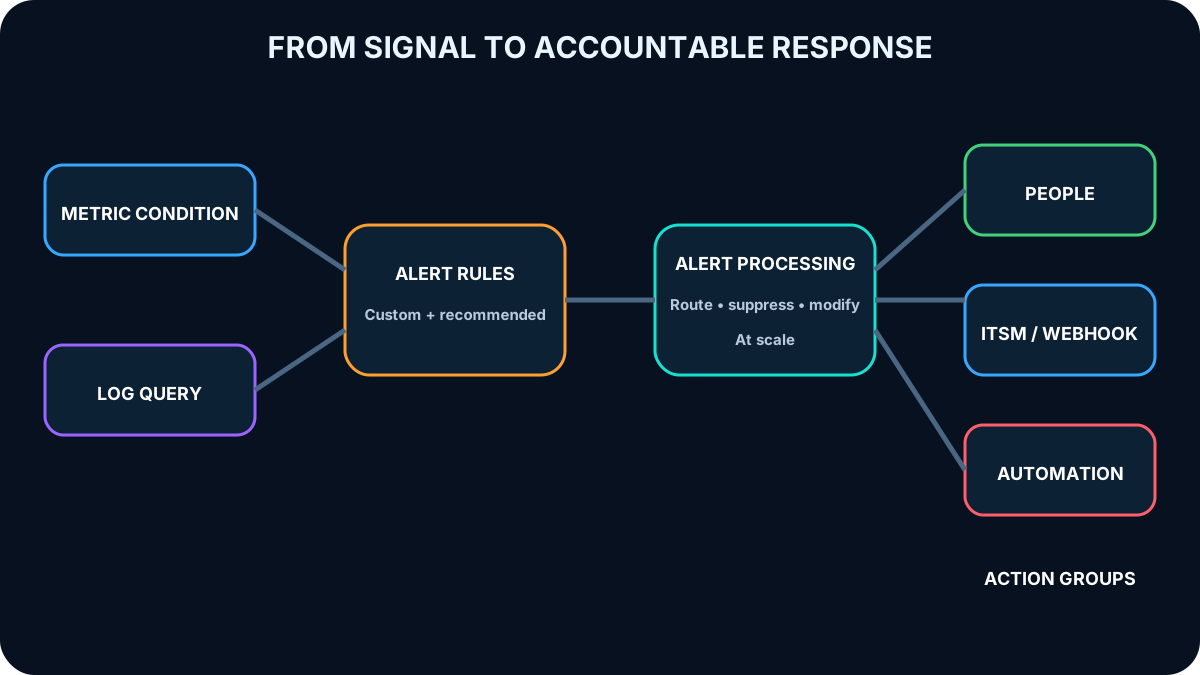
Alert rules evaluate Logs or Metrics and create an alert when a defined condition is met. Recommended alert rules provide Microsoft-curated starting points for supported resources. Action groups determine notification and automation targets, while alert processing rules can route, suppress, or modify alerts across many rules.
A complete alert design separates detection logic from fleet-wide processing and notification destinations.
Topic summary
Reliable alerting combines a meaningful signal, an evaluated condition, scalable processing, and an accountable response destination.
9. Metrics Explorer supports interactive time-series investigation
Metrics Explorer lets architects select resource metrics, dimensions, aggregations, and time ranges interactively. It is useful for investigating peak utilization, access patterns, workload behavior, and incident windows before converting a finding into a durable dashboard or alert.
Topic summary
Metrics Explorer is the interactive bridge between raw time-series values and a validated monitoring or alerting decision.
10. A Log Analytics workspace is both container and boundary
Logs stores records in a Log Analytics workspace. The workspace is an Azure resource, an administrative boundary, a geographic storage location, and a container that aggregates telemetry. An architecture may use one or more workspaces, but each additional boundary should solve a clear access, compliance, residency, or operational requirement.
Topic summary
A workspace defines where logs live, how they are administered, and which governance boundary applies to them.
Log data is organized into tables, and each table has properties and a schema shaped by the data producer. Most sources write to dedicated tables. This organization makes KQL predictable while allowing DCR transformations and custom tables to normalize selected custom telemetry.
Topic summary
Tables organize workspace data by producer and schema, enabling consistent querying without flattening every telemetry type into one structure.
12. Cost architecture includes ingestion, commitment, caps, retention, and archive
A workspace can use pay-as-you-go pricing or a commitment tier with a fixed daily capacity. A daily cap can provide a guardrail, but it must not silently undermine critical monitoring coverage. Interactive retention can be configured from 30 through 730 days, and older records can move to lower-cost archive when operational queries no longer require immediate access.
Cost controls should follow data value: collect necessary fields, transform noise before ingestion where appropriate, assign retention by table and compliance need, and review volume trends.
Topic summary
Optimize monitoring cost through deliberate collection, pricing tier, safe caps, table-aware retention, and archive rather than by sacrificing essential evidence.
13. Azure RBAC limits who can query and administer logs
Azure role-based access control grants users and groups only the monitoring permissions they need. A central workspace can still provide differentiated access aligned to the operating model, especially when queries are scoped by the Azure resources a team is authorized to manage.
Topic summary
Centralized storage does not require universal visibility; Azure RBAC can preserve least privilege for monitoring data.
Microsoft-managed physical clusters are the default hosting model. Dedicated clusters are appropriate when requirements include customer-managed key encryption, Customer Lockbox, or sustained very high ingestion volumes. These requirements should be justified because the dedicated model changes capacity and cost planning.
Topic summary
Use a dedicated cluster for explicit encryption, support-access, or sustained ingestion requirements, not as a default topology.
15. Split workspaces only for a real architectural boundary
Regional storage is required for data sovereignty or compliance.
Co-location with managed resources is necessary to avoid outbound data-transfer charges.
Departments require strict isolation and have no need for consolidated cross-team correlation.
A dedicated cluster or another workspace-level capability creates a genuine boundary.
scale alone is not a reason to split: workspaces can grow to petabytes without a fixed storage-size ceiling.
Topic summary
Residency, transfer cost, isolation, and specialized capabilities can justify multiple workspaces; raw scale generally does not.
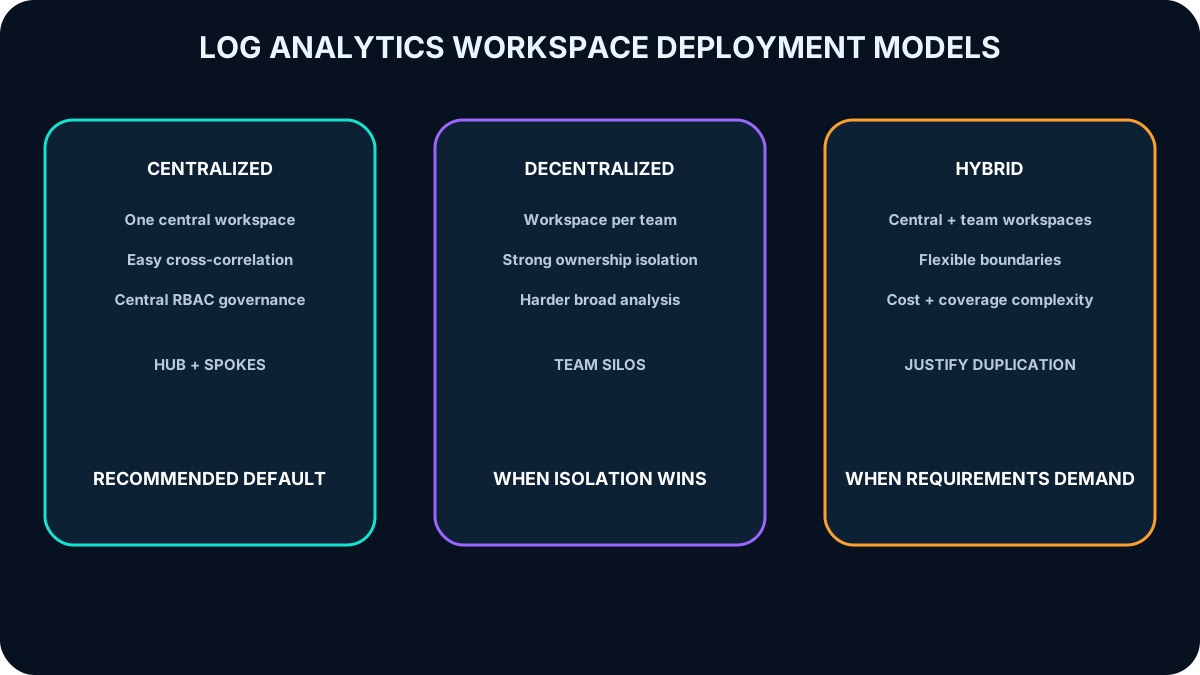
16. Centralized workspaces favor correlation and simpler operations
In a centralized, hub-and-spoke model, one team administers a central workspace and all participating resources send logs to it. Cross-resource search and correlation become straightforward, while access control and ingestion governance require disciplined central administration.
Workspace topology trades unified analysis against organizational isolation and administrative complexity.
Topic summary
Centralization improves unified search, cross-correlation, and management, but the platform team must govern access and volume carefully.
17. Decentralized and hybrid models increase isolation and complexity
A decentralized model gives each team a workspace in a resource group it owns. Security aligns naturally with resource ownership, but broad investigations become difficult. A hybrid model operates central and team workspaces together; it can be valid, yet frequently introduces duplicate cost, coverage gaps, and complex compliance evidence.
Topic summary
Decentralization isolates ownership; hybrid designs combine models but must justify added cost, duplicated data, and audit complexity.
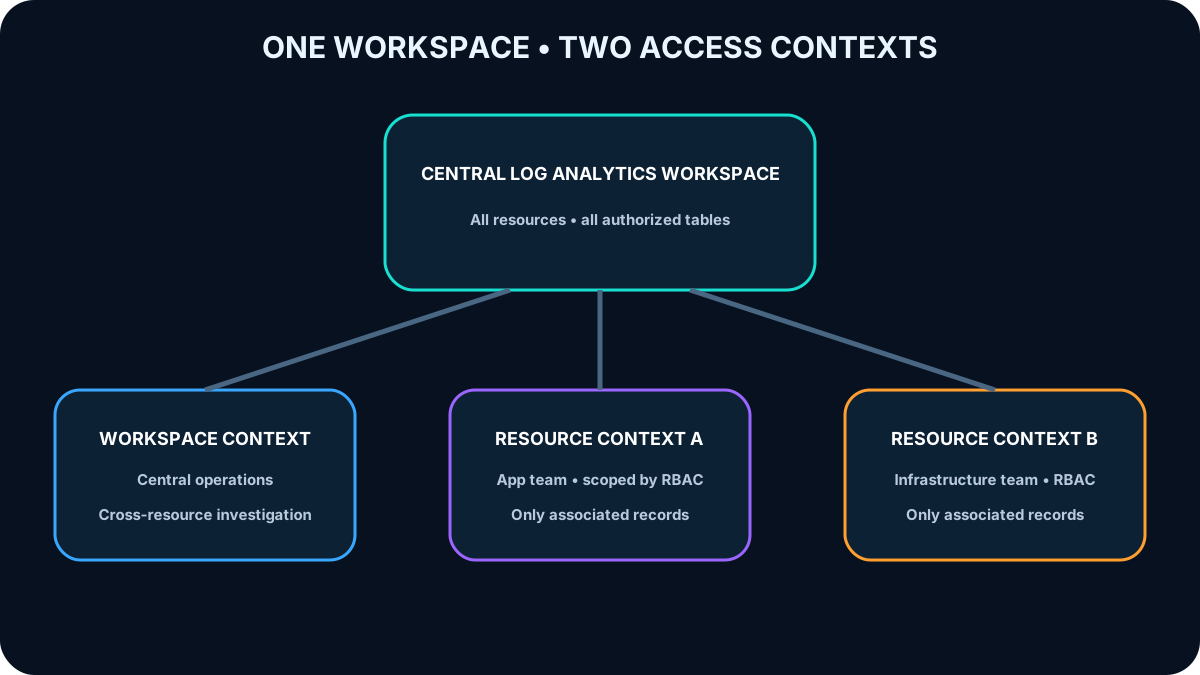
18. Workspace-context and resource-context access serve different users
Log access modes.
Mode
Query scope
Typical user
Workspace-context
All authorized data across workspace tables
Central operations, security, and cross-resource investigators
Resource-context
Records associated with a selected resource, resource group, or subscription
Application and infrastructure teams limited by resource-level Azure RBAC
One workspace can provide both a global operational view and least-privilege resource-scoped views.
Topic summary
Workspace context supports broad correlation; resource context applies Azure RBAC to a selected resource scope.
19. Do not fragment workspaces merely to accommodate growth
Logs is a high-scale service that ingests large volumes for many customers. A workspace can expand to petabytes, so workload growth should first be handled through collection governance, table plans, retention, and capacity choices rather than arbitrary workspace proliferation.
Topic summary
Workspace scale is managed through ingestion and data-lifecycle design; it rarely requires splitting the data boundary.
20. A common recommendation is one centrally governed workspace
Where residency and isolation do not force separation, a single workspace in the IT organization subscription provides a manageable foundation. Azure resources, monitoring solutions, workspace-based Application Insights, VM insights, applications, and supporting infrastructure can send their telemetry directly to it.
Resource-context querying and Azure RBAC preserve team boundaries while the central team retains a consolidated view for incident correlation.
Topic summary
A central workspace with resource-scoped access often delivers the best balance of management, correlation, and least privilege.
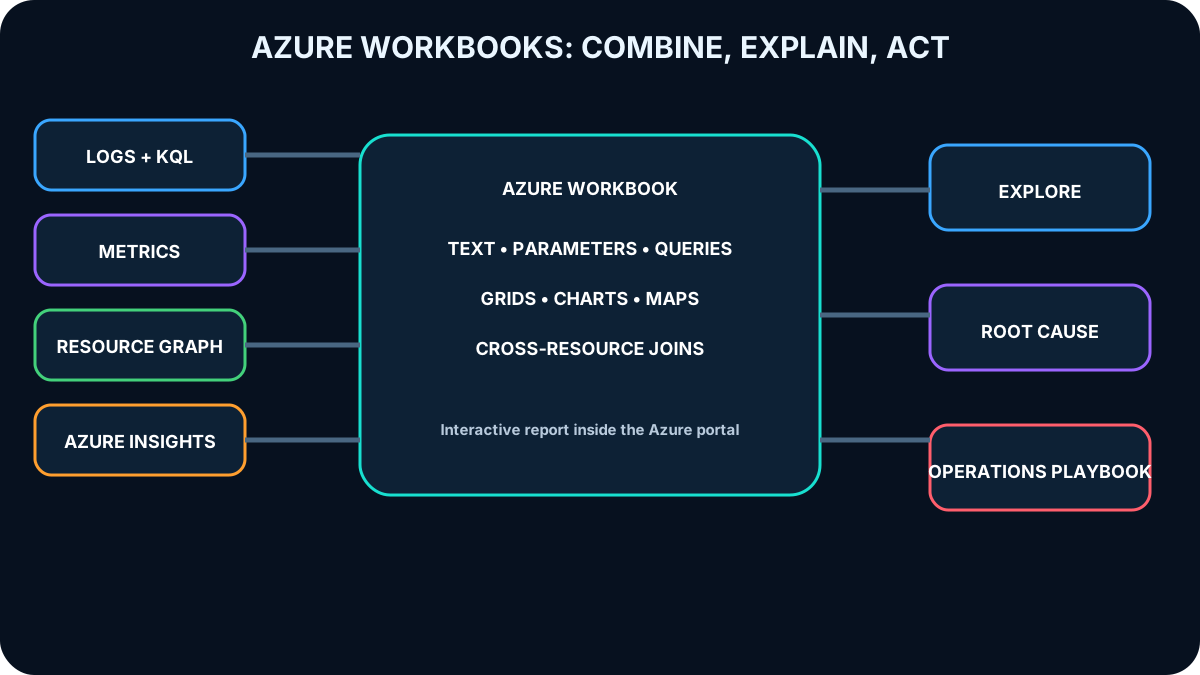
21. Azure Workbooks create interactive reports from many sources
Azure Workbooks is an feature that combines text, parameters, log queries, metrics, and visual components on a flexible canvas in the Azure portal. A workbook can query multiple Azure data sources and merge their results into one interactive operational experience.
Workbooks turn multiple telemetry sources into a single navigable investigation and reporting surface.
Topic summary
Azure Workbooks provides a flexible, interactive reporting layer across otherwise separate monitoring sources.
22. Workbooks support exploration, root-cause analysis, and playbooks
Explore application usage and unknown performance patterns.
Analyze virtual machine performance to locate high CPU or low memory conditions.
Join data across resources to reveal dependencies and correlations.
Document an incident investigation with live evidence and explanatory text.
Build an operational playbook that guides responders through repeatable checks.
Publish rich visual reports inside the Azure portal.
Topic summary
Workbooks are valuable when operators need context, interaction, explanation, and live data in the same report.
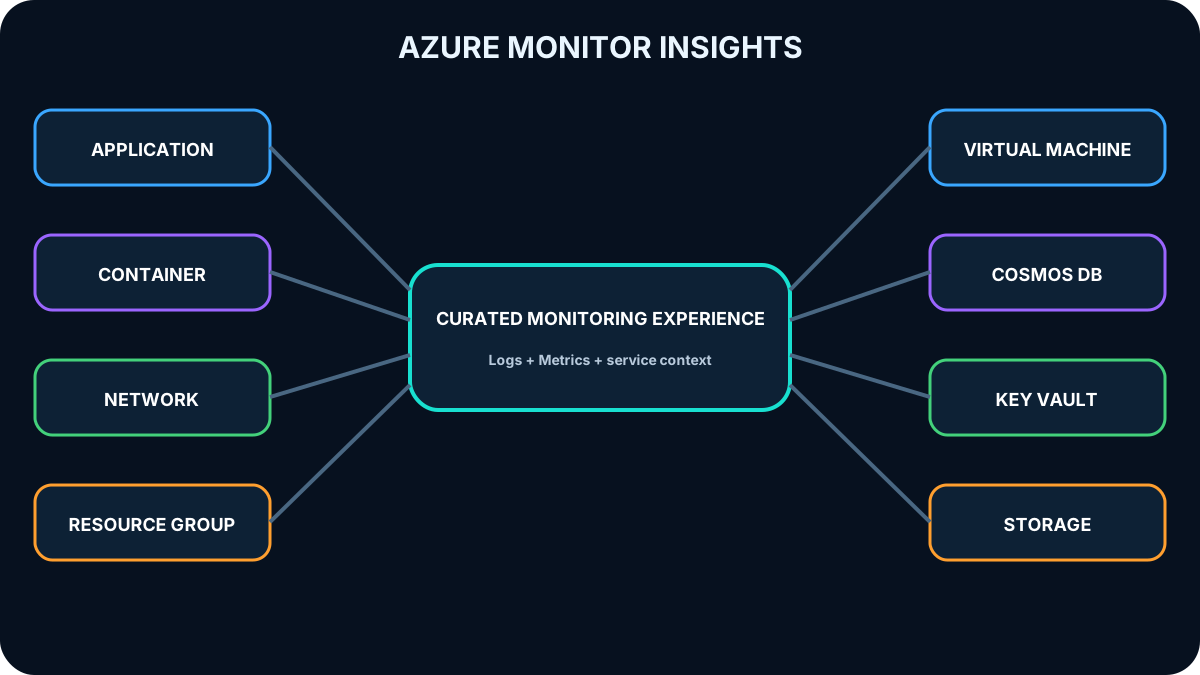
23. Azure insights provide resource-specific monitoring experiences
Azure insights are curated monitoring experiences designed for particular applications and services. They combine logs and metrics, apply resource-specific analysis, and present availability, performance, usage, capacity, failures, dependencies, and health without requiring every team to build its first dashboard from scratch.
Topic summary
Insights package logs, metrics, and domain knowledge into focused monitoring experiences for specific Azure resource types.
24. Choose the insight that matches the monitored service
Examples of insights.
Insight
Primary monitoring value
Application Insights
Application performance management, live application behavior, availability, failures, dependencies, and user experience
Container insights
Performance of and Kubernetes workloads on Azure Kubernetes Service
Network insights
Health, metrics, topology, and dependency search across network resources
Resource group insights
Triage and diagnosis with resource-group-wide health and performance context
VM insights
Windows and Linux virtual machine, scale-set, process, performance, health, and dependency monitoring
insights
Unified performance, failure, capacity, and operational-health reporting
Azure insights
Requests, performance, failures, and latency across key vaults
Azure insights
-account performance, capacity, and availability
Each insight adds a service-specific lens while remaining connected to Logs and Metrics.
Topic summary
Application, compute, network, database, security, and storage insights each expose the signals most relevant to their resource domain.
25. Combine insights with Workbooks for an operational narrative
Insights accelerate resource-specific diagnosis, while Workbooks combine that evidence with other sources in a custom report. Together they can trace a poor customer transaction from Application Insights through a dependency, virtual machine, network path, and storage account, then preserve the investigative sequence as an operational playbook.
Topic summary
Insights supply focused evidence; Workbooks assemble cross-resource evidence into a reusable investigation and communication experience.
26. handles high-volume near-real-time analytics
is a fast, highly scalable big-data analytics platform for logs, telemetry, events, traces, and time-series data. It supports end-to-end ingestion, storage, management, KQL querying, and visualization for structured, semi-structured, and unstructured sources such as websites, applications, and IoT devices.
Topic summary
provides scalable near-real-time exploration for large, diverse telemetry streams.
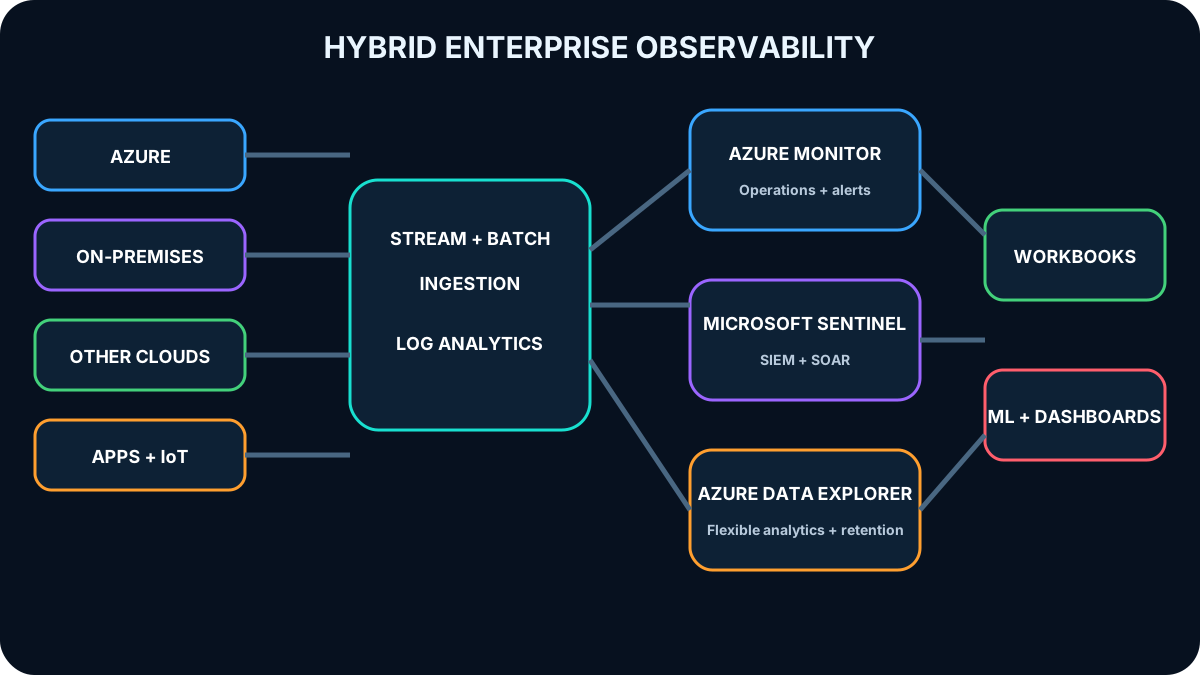
27. Use ,, and Data Explorer together
A hybrid enterprise design can ingest streaming and batch logs from Azure, on-premises systems, and other clouds. supplies native operational monitoring and alerts. adds SIEM and SOAR security operations over Log Analytics. provides a flexible analytics repository for telemetry patterns or retention scenarios beyond the packaged SaaS experiences.
The services complement one another: operations, security analytics, and flexible high-scale telemetry exploration share a governed data flow.
Topic summary
Combine for operations, Sentinel for security, and Data Explorer for flexible high-scale analytics instead of forcing one service to solve every scenario.
28. Data Explorer fills advanced and custom telemetry scenarios
Analyze application trace logs or other telemetry not supported by an out-of-the-box Monitor or Sentinel experience.
Build near-real-time dashboards, pattern-recognition queries, and time-series analysis quickly.
Apply granular role-based access control across analytics data.
Use built-in anomaly detection, forecasting, and machine-learning capabilities.
Retain large log volumes for long periods with a cost-aware data lifecycle.
Create a centralized repository for multiple log types and advanced analytics.
Topic summary
Data Explorer is strongest where telemetry volume, variety, custom analysis, near-real-time behavior, or long retention exceeds packaged monitoring experiences.
integrates with services such as and . Teams can train a model with external tools, export it for scoring in Data Explorer, and apply it to incoming telemetry for anomaly detection, classification, or forecasting.
Topic summary
External ML services can train models while applies them at telemetry scale for operational scoring.
30. Apply the architecture to the Tailwind Traders assessment
Assessment decisions and rationale.
Requirement
Best design
Why
All logs in one location with simple administration and cross-resource correlation
Centralized Log Analytics workspace
One workspace supports unified search and correlation under one responsible team
History of user activity across the tenant
Microsoft Entra audit logs
The audit log records tenant directory and identity administration activity
User experience and behavior for external-facing applications
The assessment maps centralized operations to one workspace, tenant user activity to Entra audit logs, and external application experience to Application Insights.
31. Assemble a layered monitoring strategy
Inventory business services, resources, dependencies, and responsible teams.
Define the Logs, Metrics, activity, audit, application, and security signals required for each critical scenario.
Govern agent-based collection with DCRs, associations, Agent, and .
Choose workspace boundaries for residency and access rather than for storage scale.
Set pricing, retention, archive, RBAC, query, alert, and response standards.
Use insights for focused diagnosis, Workbooks for cross-source narratives, and Data Explorer for advanced analytics.
Test alerts and incident playbooks, then continually refine collection and thresholds from operational evidence.
Topic summary
A complete strategy connects collection, storage, access, analysis, visualization, alerting, response, cost, and continuous improvement.
32. Continue the study with guided research
To deepen the design, compare centralized and decentralized monitoring for a concrete organization, map auditing solutions to evidence requirements, and build an alerting recommendation against Azure Well-Architected Framework principles. Validate every recommendation against current product limits, pricing, regional availability, and governance requirements.