Suggested time: 42 minutes • Beginner level • Aligned to the Azure management and governance domain of AZ-900
By João Ricardo Dutra••Complete original content
1. Objectives: monitor Azure and connected environments
This chapter connects recommendation, service-health, telemetry, alerting, and application-observability tools into one operating model. The same ideas apply to workloads in Azure and, where supported, to on-premises or multicloud environments.
Describe the purpose and recommendation categories of .
Distinguish Azure Status, Service Health, and Resource Health.
Explain the platform and its central data model.
Describe Log Analytics, Alerts, action groups, and Application Insights.
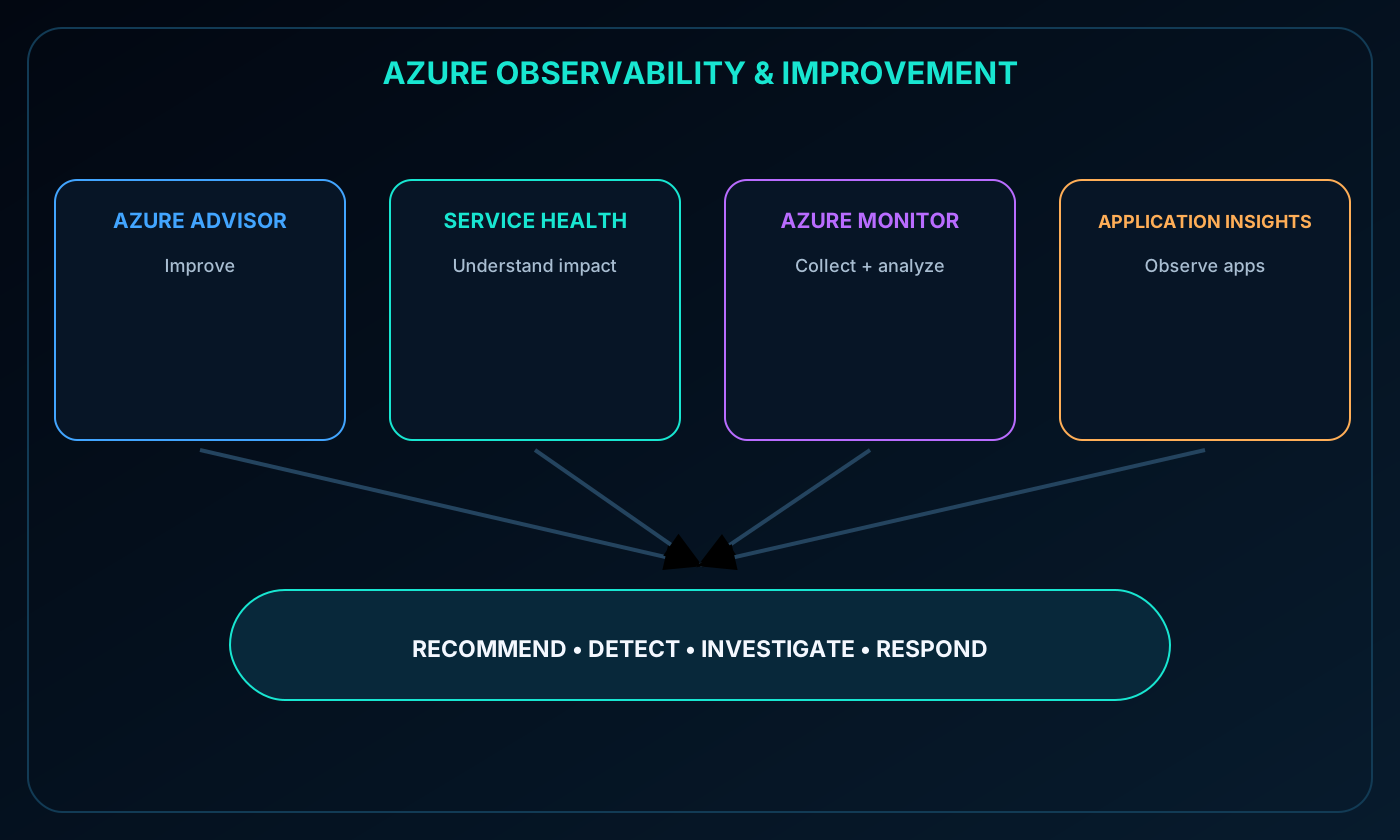
These tools answer different operational questions. Advisor identifies ways to improve a configuration. Service Health explains whether Azure services or individual resources are healthy. collects telemetry, supports investigation, and triggers responses. Used together, they support continuous improvement before, during, and after an incident.
Operational question and the best starting point.
Question
Start with
How can this workload become more reliable, secure, efficient, or economical?
Is a broad Azure event or planned maintenance affecting my environment?
What do metrics, logs, and traces reveal about the workload?
How is a web application behaving for users and dependencies?
Application Insights
3. Purpose of
evaluates Azure resource configurations and usage telemetry against Microsoft best practices. It produces personalized recommendations intended to improve reliability, security, performance, operational efficiency, and cost efficiency.
Advisor is built into the . Its recommendations are guidance, not automatic proof that a change is safe for every workload; the owner should validate impact, dependencies, and business requirements before implementation.
4. From recommendation to action
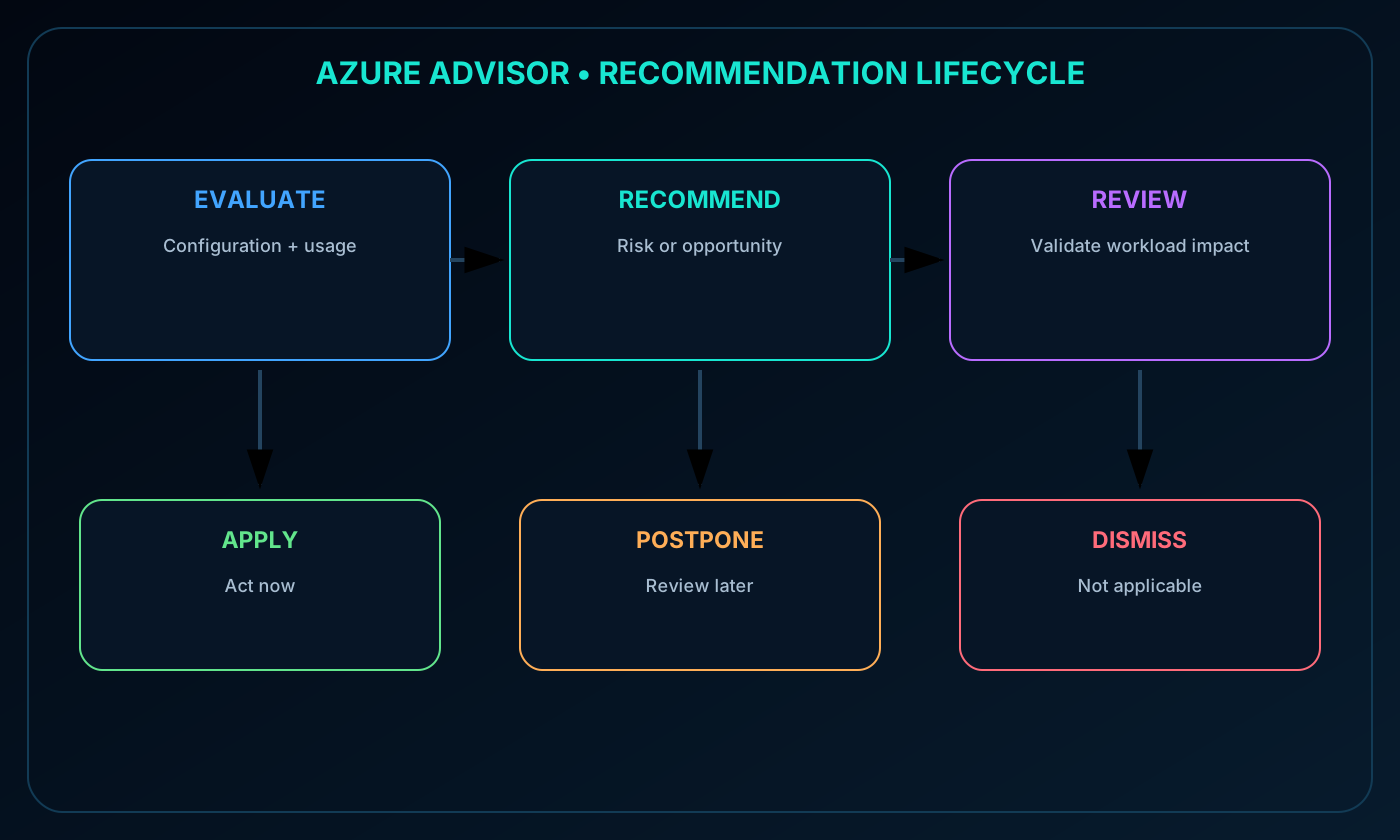
Each recommendation explains an opportunity or risk and proposes an action. An administrator can implement it immediately, postpone it for later review, or dismiss it when it does not apply. Notifications can be configured so teams learn when new recommendations appear.
lifecycle from resource evaluation to recommendation, review, action, postponement, or dismissal.
5. Advisor dashboard, scope, and filters
The Advisor dashboard consolidates recommendations across subscriptions. Filters narrow the view by subscription, resource group, or service, helping an owner focus on the resources within a particular responsibility boundary.
A recommendation can be opened for context and suggested remediation. After a change is applied, the service may need time to reassess the resource and update the recommendation state.
6. The five categories
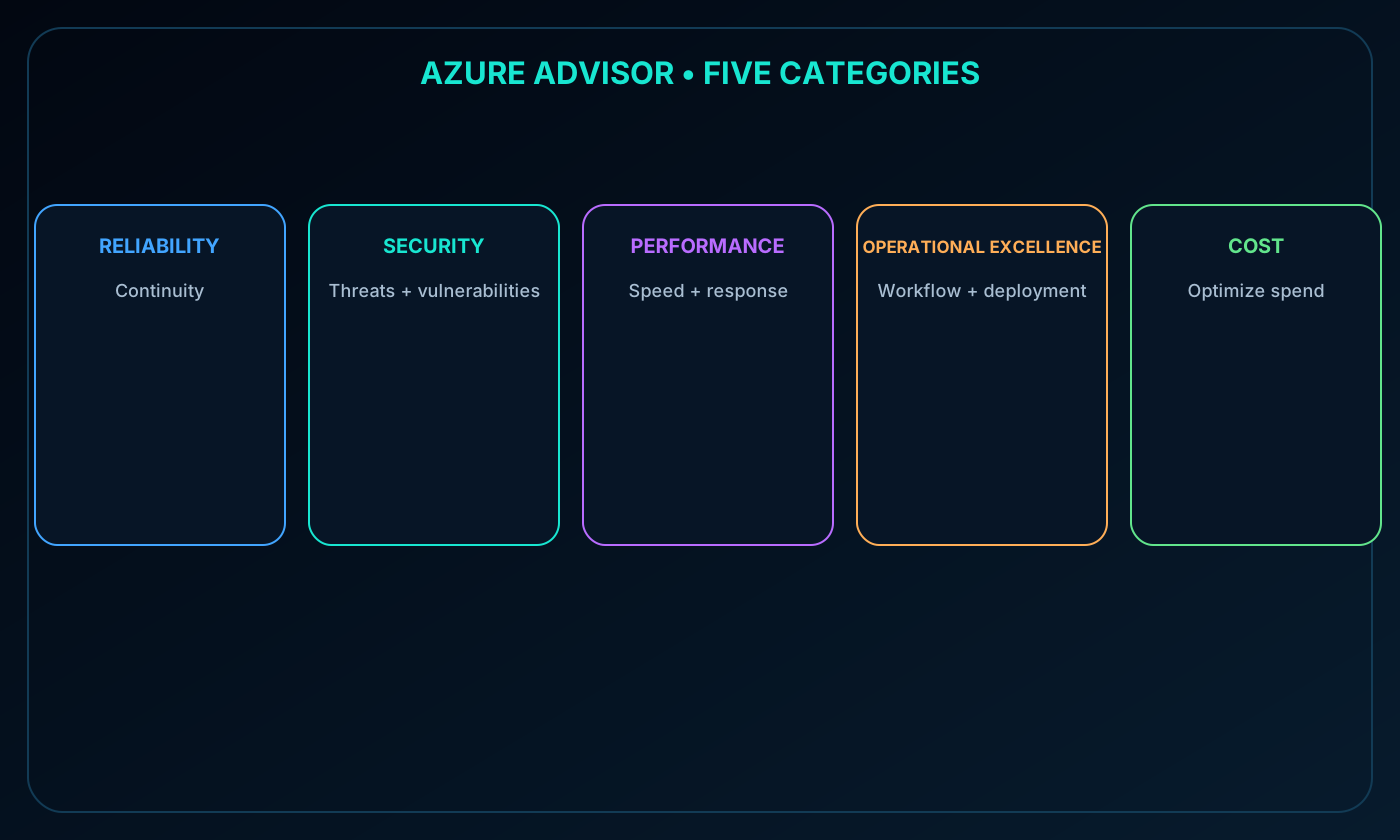
Advisor recommendations are organized into five categories.
Category
Operational intent
Reliability
Flag configuration risks that could interrupt important applications
Security
Identify threats and vulnerabilities that could contribute to a breach
Performance
Recommend changes that can improve application speed or responsiveness
Operational Excellence
Improve workflows, deployment practices, and resource manageability
Cost
Find opportunities to reduce or optimize Azure spending
Five categories: reliability, security, performance, operational excellence, and cost.
7. Purpose of
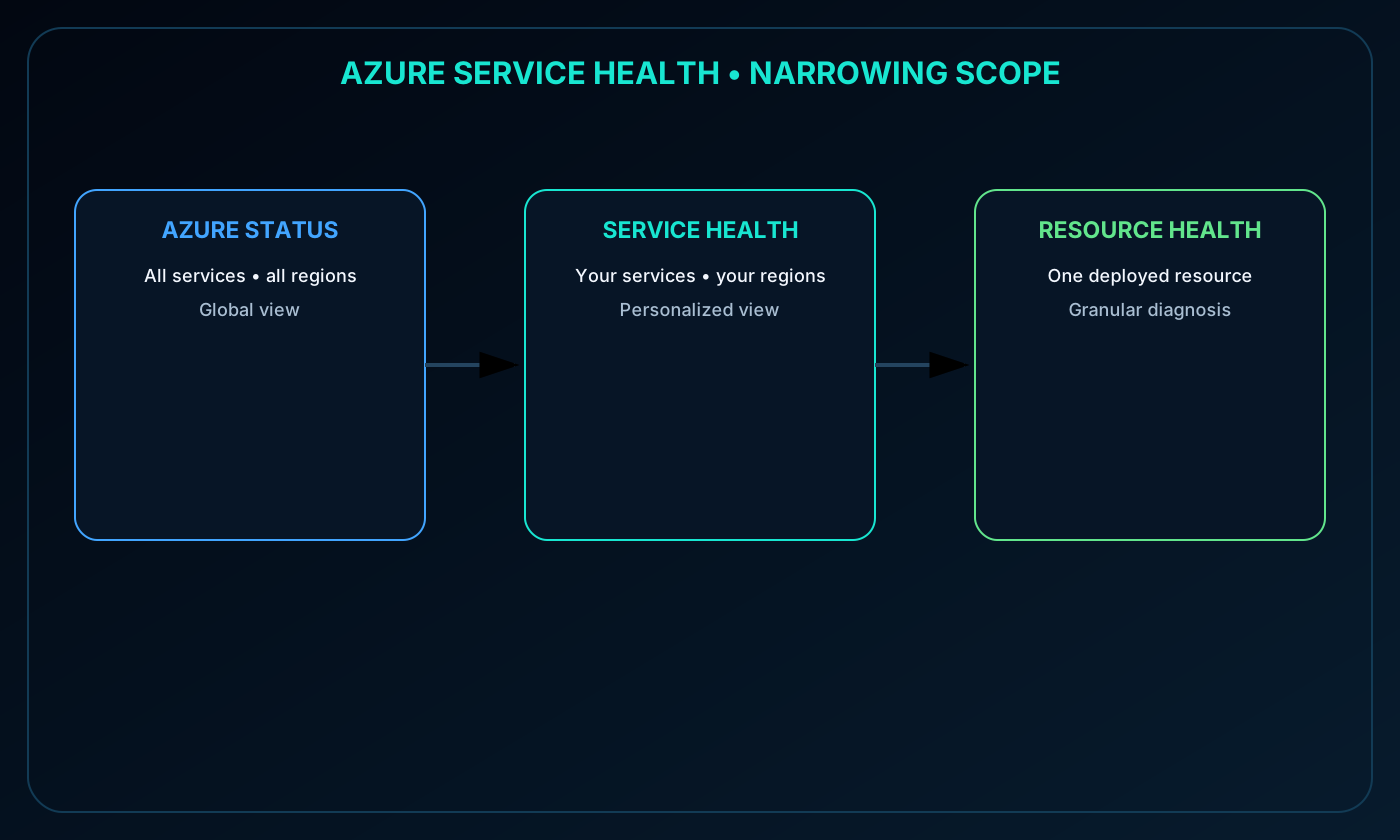
brings together health information about Azure itself, the services and regions an organization uses, and individual deployed resources. Its three views narrow the scope from global conditions to a single resource.
narrowing from Azure Status to Service Health and then Resource Health.
8. Azure Status: the global view
Azure Status presents a public, global picture of service health across Azure services and regions. It is a useful first reference for a widespread incident when the affected subscriptions or resources are not yet known.
Because it is broad, Azure Status does not replace the signed-in, personalized information available through Service Health.
9. Service Health: services and regions you use
Service Health uses the signed-in context to show events relevant to the Azure services and regions associated with an organization. It covers service incidents, planned maintenance, and health advisories, and it can send alerts automatically.
This personalized view helps a team decide whether a platform event is likely to intersect with its own deployment footprint.
10. Resource Health: one resource at a time
Resource Health focuses on an individual resource, such as a virtual machine. It reports whether that resource is operating normally or experiencing a problem and helps distinguish an Azure-platform cause from a condition within the customer environment.
11. Using the three health views together
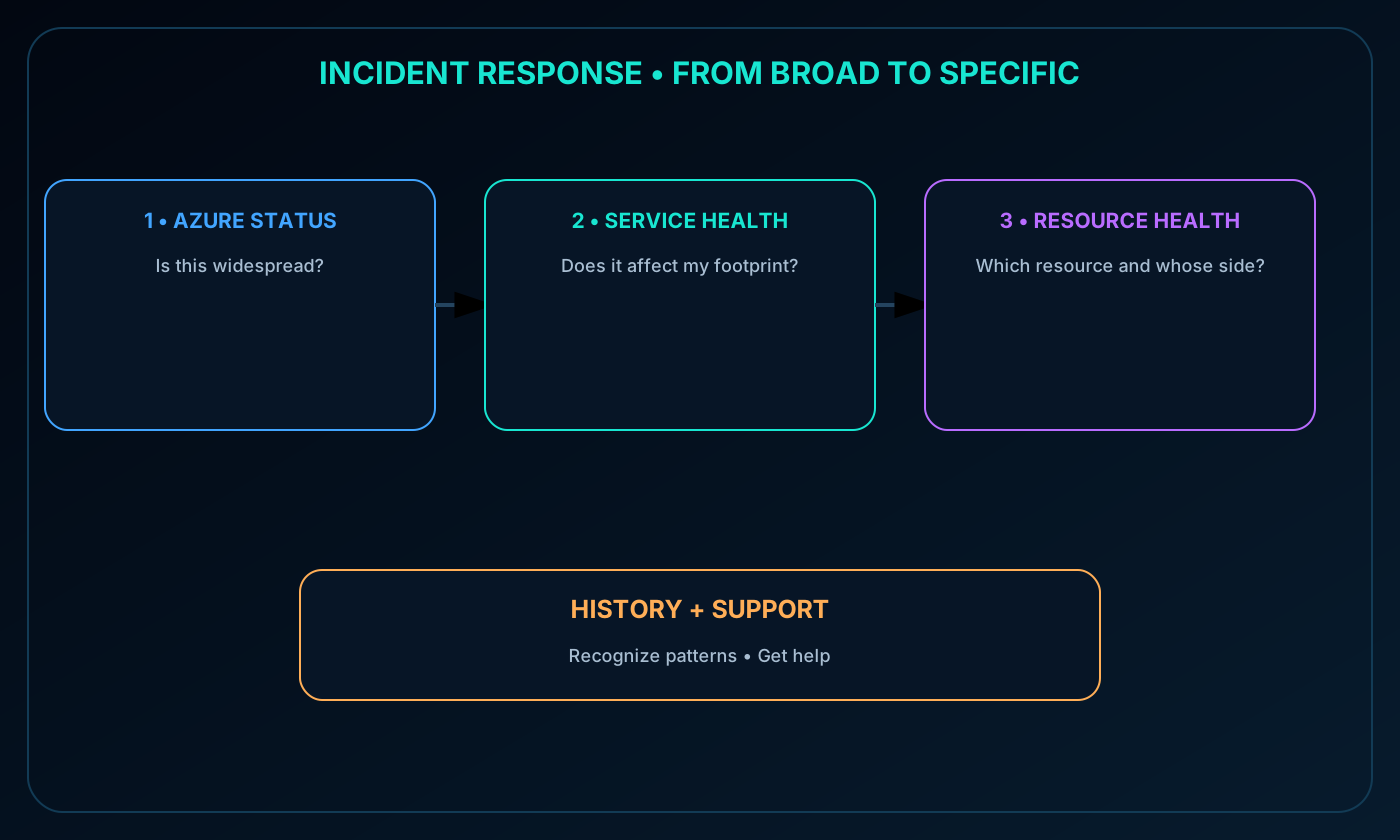
A responder can begin with the broad Azure Status view, move to the personalized Service Health view, and then inspect Resource Health for a specific component. Historical alerts help reveal recurring patterns, while support links provide a path to assistance when an event affects a workload.
Incident response flow using Azure Status, Service Health, Resource Health, alert history, and support.
12. as an observability platform
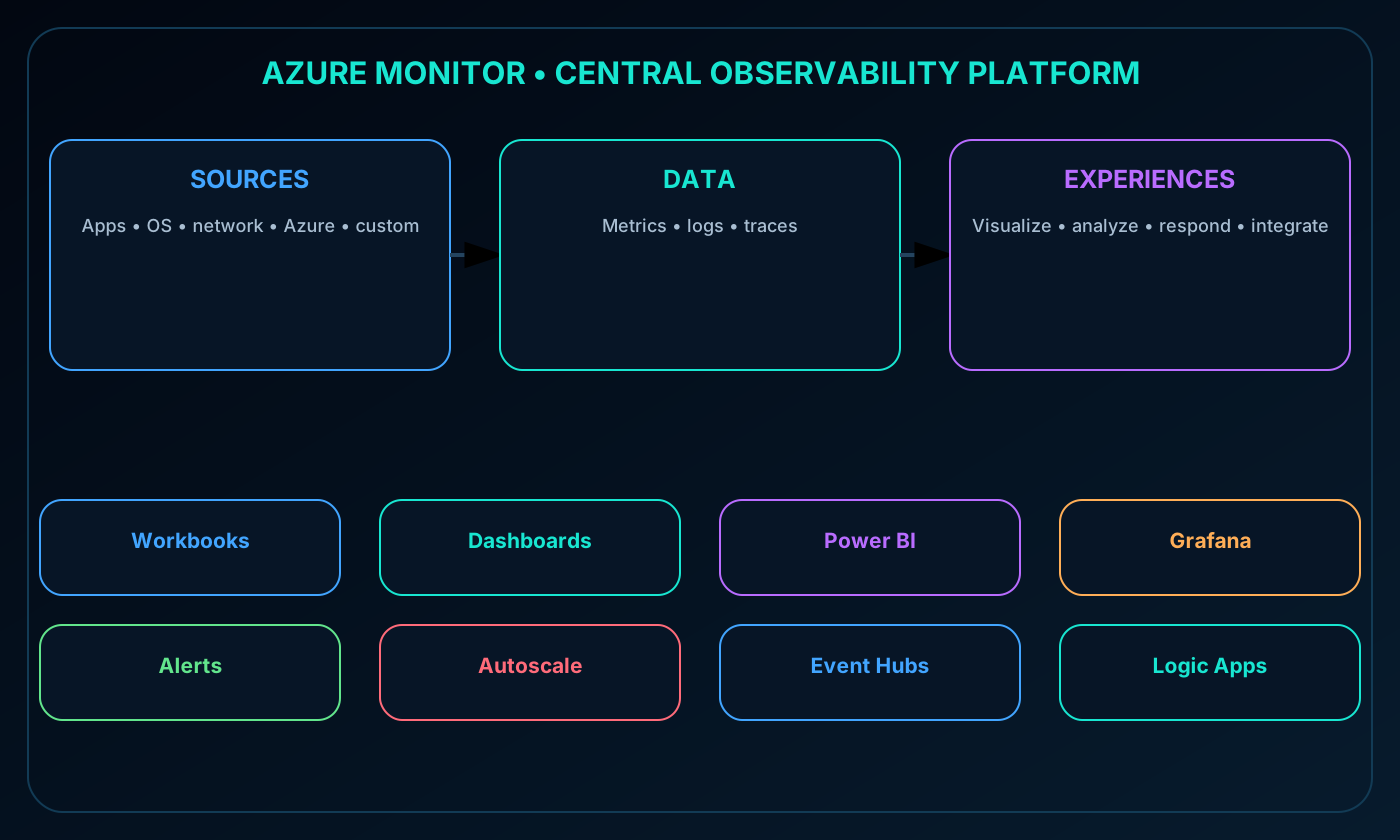
collects, analyzes, visualizes, and acts on telemetry from Azure resources and applications. It can also support connected on-premises and multicloud environments, creating a central observability experience across infrastructure and software.
The platform gathers data from workloads, infrastructure, the Azure platform, operating systems, network layers, and custom sources.
13. Data, experiences, and integrations in
The source module organizes monitoring data into metrics, logs, and traces. stores this telemetry centrally and exposes it through dashboards, workbooks, queries, visualizations, alerts, autoscale actions, and integration endpoints.
Visualize with workbooks, dashboards, , or Grafana.
Analyze through Metrics Explorer and Log Analytics.
Respond through alerts, action groups, and autoscale.
Log Analytics is the tool for writing and running queries against log and trace data collected by . A query can perform a simple filter, such as locating errors from the last hour, or support deeper analysis and trend visualization over time.
This query-driven approach helps responders move from a symptom to evidence distributed across applications and resources.
15. Alerts and action groups
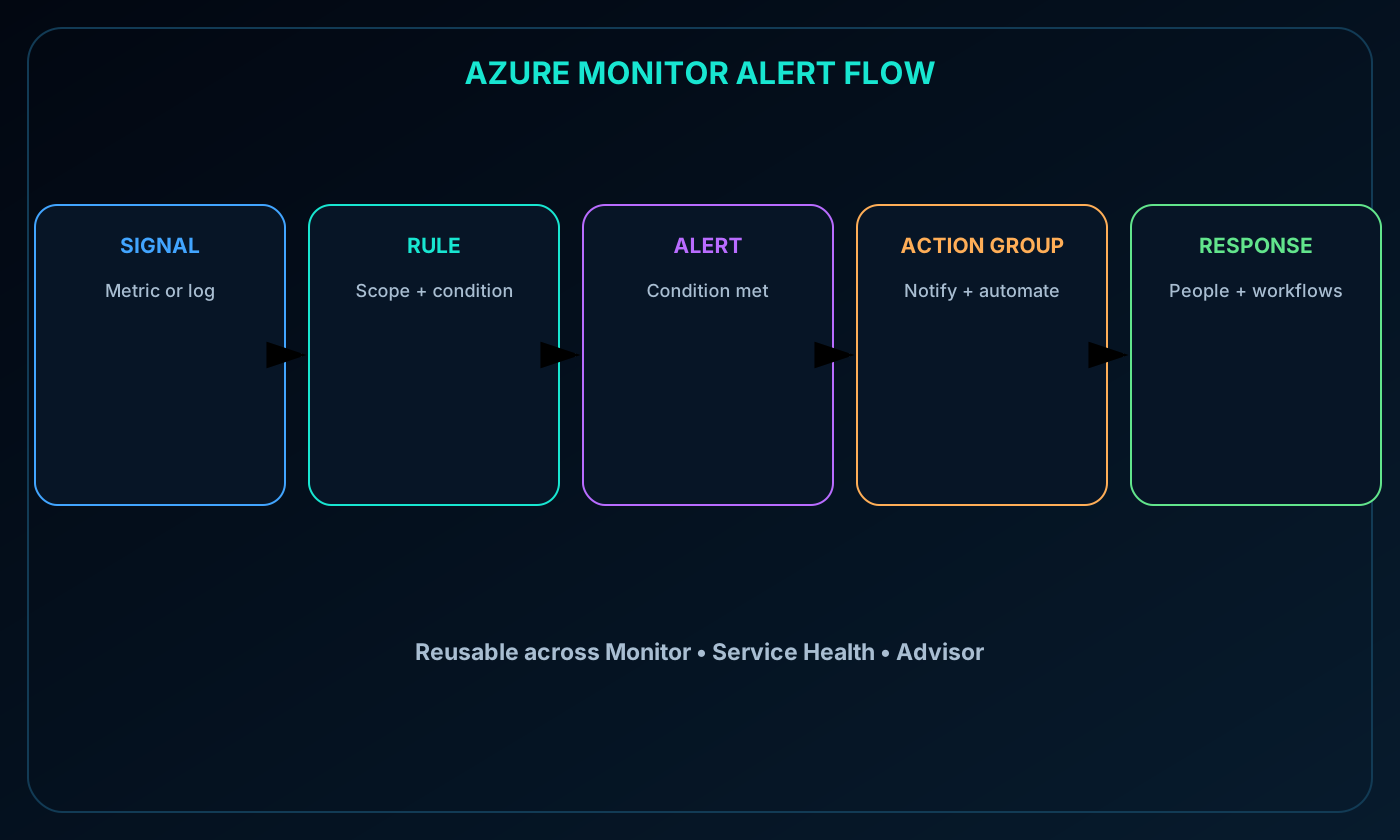
An alert rule defines the resource or scope, the signal, and the condition to evaluate. When the condition is met, creates an alert and invokes the associated action group, which determines who is notified and what automated response runs.
Alerts may be metric-based or log-based. A metric rule might notify a team when virtual-machine CPU remains above 80%, while a log rule might search several resources for a recurring error pattern. Action groups are reusable by ,, and .
alert flow from metric or log condition through an alert rule to a reusable action group and response.
16. Application Insights setup and scope
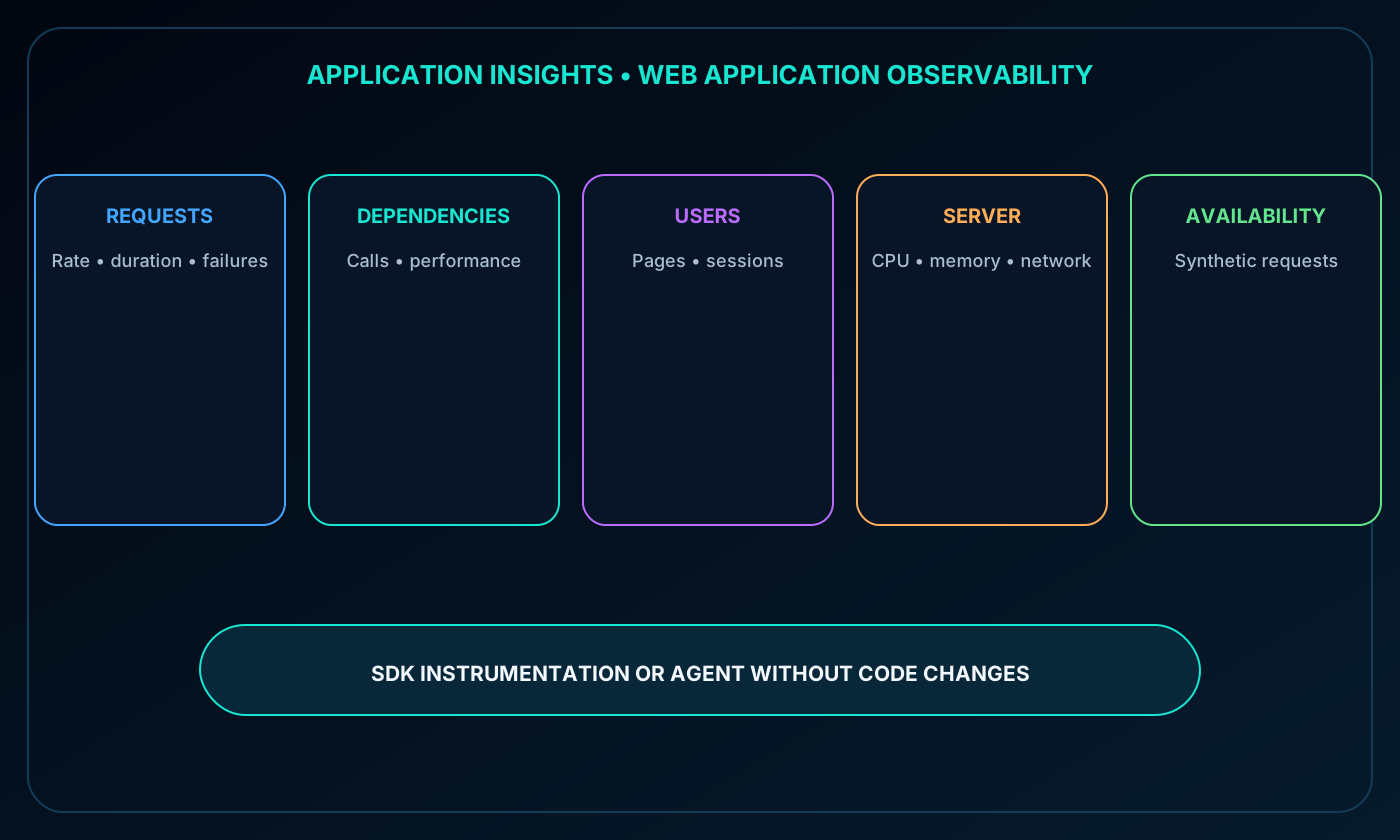
Application Insights is an feature for observing the performance and usage of web applications in Azure, on-premises environments, or another cloud. It can be enabled by adding an SDK to application code or, when supported, by enabling an agent without changing the code.
17. Application telemetry and availability tests
Request volume, response time, and failure rate.
Dependency calls and the time or failures associated with them.
Page-load duration, user counts, and session trends.
Server counters such as CPU, memory, and network usage.
Synthetic availability tests that send requests even when real traffic is low.
Application Insights collecting requests, dependencies, pages, users, sessions, server counters, and availability tests.
18. Module assessment with explained answers
Paraphrased knowledge check.
Question
Answer
Why
Which option is not an recommendation category: Reliability, Capacity, or Cost?
Capacity
Reliability and Cost are categories; Capacity is not one of the five category names.
A regional outage affects a region containing your VMs. Which Service Health component shows whether your application footprint is affected?
Service Health
It personalizes service and region events to the subscriptions and services you use.
19. Chapter summary and continued practice
recommends improvements; explains platform, service, region, and resource health; centralizes telemetry and response; Log Analytics supports investigation; alerts and action groups automate notification and reaction; and Application Insights focuses on application behavior and availability.
The source recommends Microsoft Learn material for getting started with , introducing , and monitoring resource usage, performance, and availability with . It also mentions pay-as-you-go and a free Azure trial of up to 30 days; verify current offers before relying on promotional terms.
Explore with Copilot Chat
Design a monitoring strategy that combines ,,, Log Analytics, alerts, and Application Insights.
Walk through an outage and identify which health or monitoring view to check at each diagnostic stage.
Define severity levels, thresholds, action groups, and escalation paths for a production workload.