Observability: Logs, Metrics, and Tracing with OpenTelemetry
From application instrumentation to distributed correlation, SLOs, and production API diagnostics
In-depth edition - study material and professional reference
By João Ricardo Dutra••Complete material
Chapter presentation
Previous chapters have shown that an API transaction can traverse DNS, balancers, gateways, service meshes, services, banks and messaging systems. When something fails, no single component sees the entire journey. Observability is the discipline that transforms signals emitted by these components into the ability to understand the internal state of the system, reconstruct causality and evaluate impact for consumers and business processes.
Logs, metrics, and distributed tracing are often called the pillars of observability. The expression is useful, but it can lead to a fragmented interpretation. The value isn't in storing three types of data in different tools; is to correlate them by service identity, environment, version, request, and business context. A metric indicates that latency has increased, a locates the responsible step, and a log explains the specific error.
OpenTelemetry provides APIs, SDKs, , protocols, and a vendor-agnostic Collector to produce, process, and export telemetry. It does not replace the observability backend. Its role is to standardize instrumentation and transport, reducing dependence on proprietary agents and allowing consistent signals to be sent to different destinations.
This chapter delves into observability theory, the design of logs and metrics, the anatomy of traces and spans, context propagation, , Collector, , sampling, exemplars, SLOs, security, cardinality control and troubleshooting. The focus remains on enterprise APIs, gateways and distributed architectures.
How to study this chapter
Choose a single business journey – for example, create payment – and track how it appears across all three signals. Ask which identity describes the service, how context traverses each hop, which attributes are stable, and how the diagnosis would change if one of the signals were missing.
Learning Objectives
Differentiate between monitoring, telemetry, observability, diagnosis and auditing.
Design structured logs, useful metrics, and distributed traces with consistent context.
Explain ,, context, , event, link, status and .
Understand W3C , traceparent, tracestate, and interprotocol propagation.
Describe APIs, SDKs, auto-instrumentation, and OpenTelemetry Collector.
Apply and control high cardinality attributes.
Compare , parent-based sampling and .
Relate exemplars, logs and traces to metrics and SLOs.
Design resilient, safe and economically sustainable pipelines.
Diagnose instrumentation failures and correlation gaps in API Gateways and microservices.
Chapter structure
32.1 Observability, monitoring and telemetry
32.2 Signals and correlation
32.3 Structured logs
32.4 Metrics and cardinality
32.5 Distributed tracing and spans
32.6 Context propagation and
32.7 OpenTelemetry: API, SDK and instrumentation
32.8 and OpenTelemetry Collector
32.9 and Resources
32.10 Sampling and exemplars
32.11 ,, alerts and dashboards
32.12 Observability in gateways, Kubernetes and messaging
32.13 Security, privacy, costs and troubleshooting
Summary, checklist, laboratories, exercises, glossary and references
32.1 Observability, monitoring and telemetry
Telemetry is the set of data emitted by the system: event records, measurements, traces, profiles and other signals. Monitoring uses part of this data to monitor known conditions, compare values with limits and trigger alerts. Observability is a broader property: the ability to infer internal state and answer novel questions from available external signals.
A system can be intensely monitored and still be poorly observable. Dozens of CPU, memory, and availability dashboards don't explain why only consumers in one region receive 502 when querying a specific backend. Observability requires context, correlation, appropriate granularity, and a data architecture that allows you to navigate from aggregate symptom to individual evidence.
Auditing has a different objective. An audit log records actions relevant to security and compliance, preserving authorship, integrity, and retention. It can participate in investigations, but should not be confused with diagnostic log. Mixing the two uses leads to too much sensitive data in operational tools or incomplete audit trails.
Table 1 - The concepts complement each other, but meet different objectives.
Concept
Main question
Example
Telemetry
What signals did the system send?
Logs, metrics, traces and profiles.
Monitoring
Did a known condition occur?
Error rate above threshold.
Observability
What explains this behavior?
Correlate route, version, backend and .
Audit
Who did what, when and under what authority?
Change of policy or access to sensitive data.
32.2 Logs, metrics and traces as correlated signals
Logs record discrete events with detailed context. Metrics represent aggregate measurements and are powerful for trends, alerts, and capacity. Traces represent the causal path of an operation through processes and services. Each signal has different costs, query models and granularities; none of them are sufficient for all diagnoses.
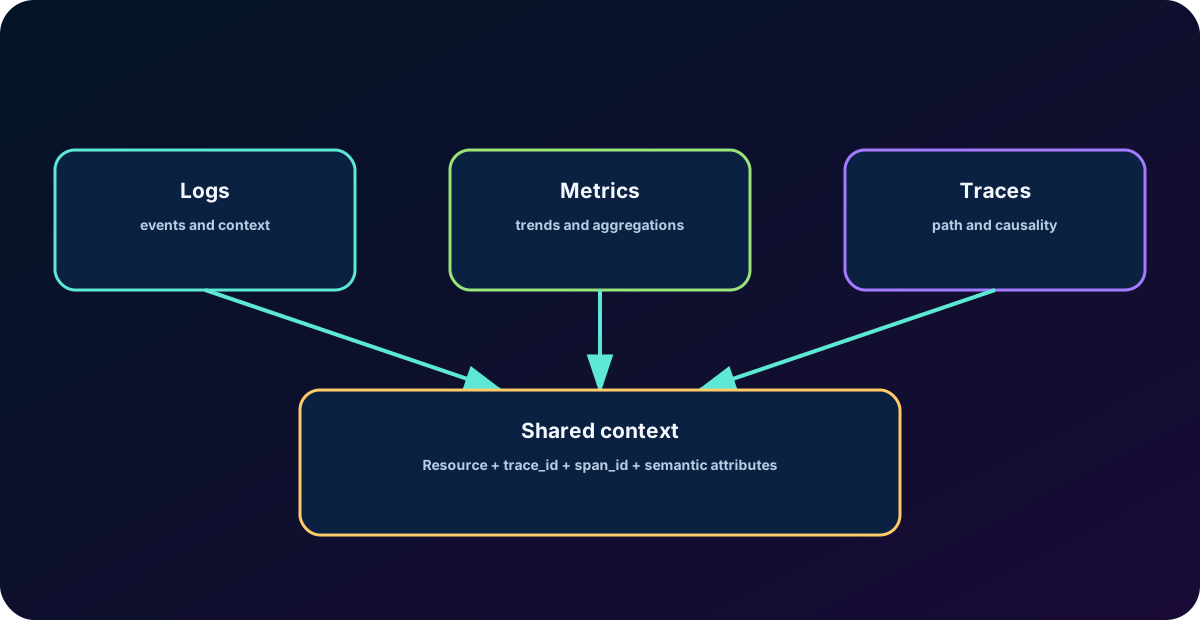
Correlation depends on common attributes. identifies the entity that produced the telemetry, such as service, instance, pod, cluster, and environment. ID and ID connect logs to a specific run. Semantic attributes standardize concepts such as HTTP method, route, messaging system, database and error code. Without consistency, dashboards and queries became sets of exceptions per team.
OpenTelemetry also treats and profiles as adjacent signals or mechanisms. propagates key-value pairs across the distributed context; profiles record usage at the code level and are evolving in the ecosystem. In this chapter, the focus remains on the three signals most present in APIs, without ignoring that modern architecture can correlate them with other data.
Figure 1 - Signals gain operational value when they describe the same entity and the same journey.
32.3 Structured logs and operational events
A structured log represents the event as typed fields or key-value pairs, typically serialized in JSON or the agent's native format. Instead of just writing "payment failed", the record includes timestamp, severity, service, environment, version, operation, error code, trace_id, span_id, and allowed business identifiers. This framework improves automatic filtering, aggregation, and correlation.
Severity must reflect the capacity for action. DEBUG and help in controlled environments; INFO records relevant operational events; WARN indicates degradation or unexpected condition that did not interrupt operation; ERROR records failure of an action; FATAL or equivalent indicates inability to continue. Logging every exception as ERROR creates noise and destroys the value of the alert.
Logs need to avoid unnecessary personal data, tokens, cookies, secrets, full payloads and financial numbers. Further masking is not a sufficient defense, because the data may have already been transported or persisted. The correct design starts at the source, with allowlist of fields, data classification, proportional retention and restricted access.
Table 2 - Useful logs are drawn as an operational contract.
Good practice
Reason
Antipattern
Stable fields
Enable reusable queries and alerts.
Free messages with different formats.
Reliable timestamp
Orders events and facilitates correlation.
Divergent clocks without synchronization.
and IDs
Connect the event to the .
Correlation ID created only in one service.
Writing at the source
Prevents exposure of secrets and PII.
Remove data only in the logs backend.
32.4 Metrics, instruments, aggregations and cardinality
Metrics represent numerical observations aggregated over time. Counters accumulate events, such as requests and errors. Histograms distribute values, such as duration and payload size, into ranges or representations suitable for the backend. Gauges record a current value, such as open connections or queue depth. UpDownCounters represent quantities that increase and decrease.
The choice of instrument defines how the measurement can be aggregated. A request duration should not be recorded as just an average, because the average hides tails. Histograms allow you to consult percentiles and distribution. Still, incorrectly aggregated percentiles can produce erroneous conclusions; It is necessary to understand the backend model and the time window.
Cardinality is the number of distinct combinations of attributes. Adding user_id, order_id, full URL, or trace_id as a metric label creates almost unlimited series, increases memory and cost, and can crash the pipeline. Metrics should use limited, stable dimensions such as normalized route, method, status class, region, and version. Individual evidence remains in logs or traces.
Table 3 - The instrument needs to represent the semantics of the measurement.
Instrument/form
Typical usage
Example in APIs
Counter
Events that only grow.
Requests, errors and retries.
Histogram
Distribution of values.
Duration, request size and queue.
Gauge
Value observed at the moment.
Open WebSocket connections.
UpDownCounter
Quantity that rises and falls.
Operations in progress.
Cardinality rule
Metric attributes must answer aggregate questions. Practically unique identifiers belong to logs and traces. Before adding a dimension, estimate how many different values it can take per environment, service, and retention window.
32.5 Distributed tracing, traces and spans
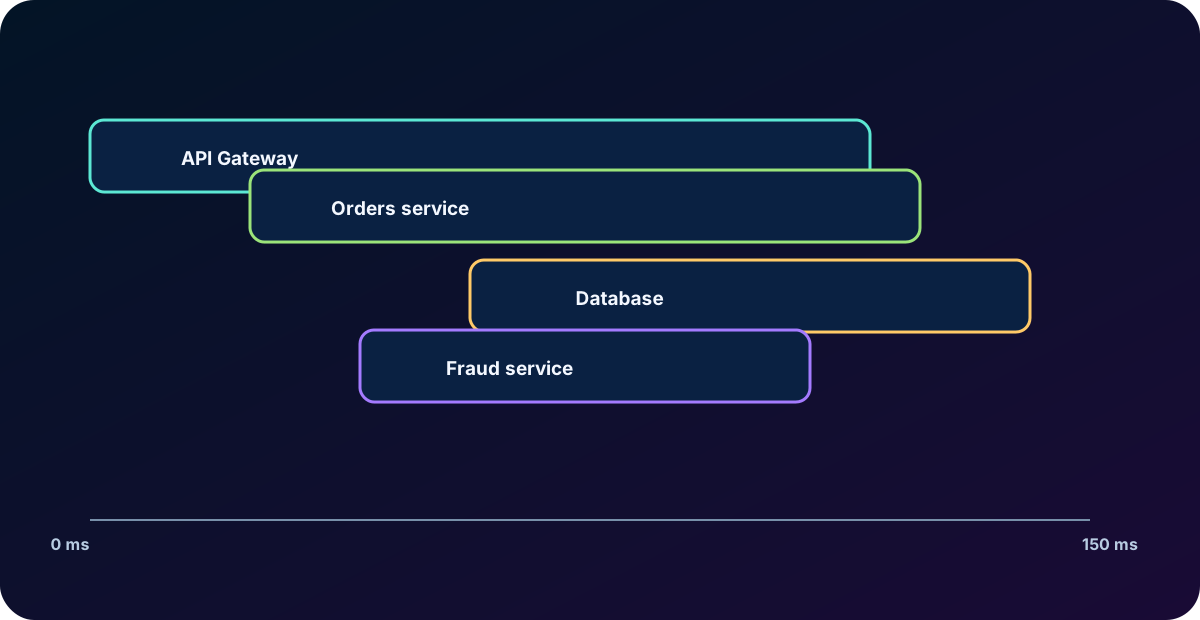
A represents a distributed operation, such as an API call that crosses gateway, service, messaging and bank. Each step is represented by a , with name, time interval, context, attributes, events, status and relationships with other spans. The framework allows you to observe total latency, critical path, and triggered dependencies.
SpanKind describes the role of the as SERVER, CLIENT, PRODUCER, CONSUMER, or INTERNAL. Classification helps you understand boundaries and calculate metrics from traces. Events record specific occurrences within the , as an exception. Links relate spans that do not have a single parent-child hierarchy, a common situation in asynchronous and fan-out processing.
The name must have low cardinality and reflect the operation, not the concrete identifier. In HTTP, a normalized route is preferable to the full URL. In messaging, the name of the destination and the operation help to reconstruct production and consumption. The must not be transformed into indiscriminate storage of payloads; attributes and events obey the same privacy rules as logs.
Figure 2 - A shows the decomposition of latency and the critical path of the transaction.
32.6 Context propagation, W3C and
For spans from different processes to belong to the same , the context needs to cross the network boundary. The W3C standardizes the traceparent and tracestate headers for HTTP. traceparent carries version, ID, parent ID and flags. tracestate transports vendor-specific information in an interoperable manner. Instrumentations must extract the incoming context and inject it into outgoing calls.
In gRPC, messaging, and proprietary protocols, the same principle is applied by metadata or message properties. Propagation must respect trust boundaries: accepting external IDs without validation or copying all to internal systems can introduce abuse, leakage and increased payload.
carries application context in key-value pairs. He must not transport secrets, personal data or high cardinality information without justification. As it can cross many services, a small field is multiplied by the entire journey. also does not replace authorization; the application should not trust a propagated claim just because it arrived in the context.
OpenTelemetry separates API and SDK. The API is used by libraries and applications to create instruments without depending on a specific implementation. The SDK implements sampling, processing, aggregation and export. This separation allows a library to be instrumented without requiring the consumer to send data to a specific supplier.
Manual instrumentation is suitable for business operations and sections that generic instrumentation does not understand. Self-instrumentation uses agents, bytecode, monkey patching, eBPF or equivalent mechanisms to capture frameworks and libraries with little code change. The combination is usually superior: automatic for infrastructure coverage and manual for business semantics.
Instrumenting does not mean generating as much data as possible. Each ,, log and series has a cost. The team must define a telemetry strategy: which journeys are critical, which attributes are required, which conventions are stable, which signals will be derived, and how instrumentation will be tested alongside the code.
Table 4 - OpenTelemetry separates instrumentation contract and pipeline execution.
Component
Responsibility
Example
API
Surface used by instrumentation.
Tracer, Meter and Logger APIs.
SDK
Processes and exports the signal.
Sampler, SpanProcessor and MetricReader.
Instrumentation Library
Captures a framework or library.
HTTP client, JDBC, gRPC or Kafka.
Auto-instrumentation
Applies instrumentation without extensive code changes.
Java agent or equivalent mechanism.
32.8 and OpenTelemetry Collector
is OpenTelemetry's native protocol for transporting telemetry. It can operate over gRPC or HTTP and has templates for traces, metrics and logs. The protocol reduces the need for different formats per vendor, but does not eliminate network decisions, authentication, compression, queuing, retry, and loss protection.
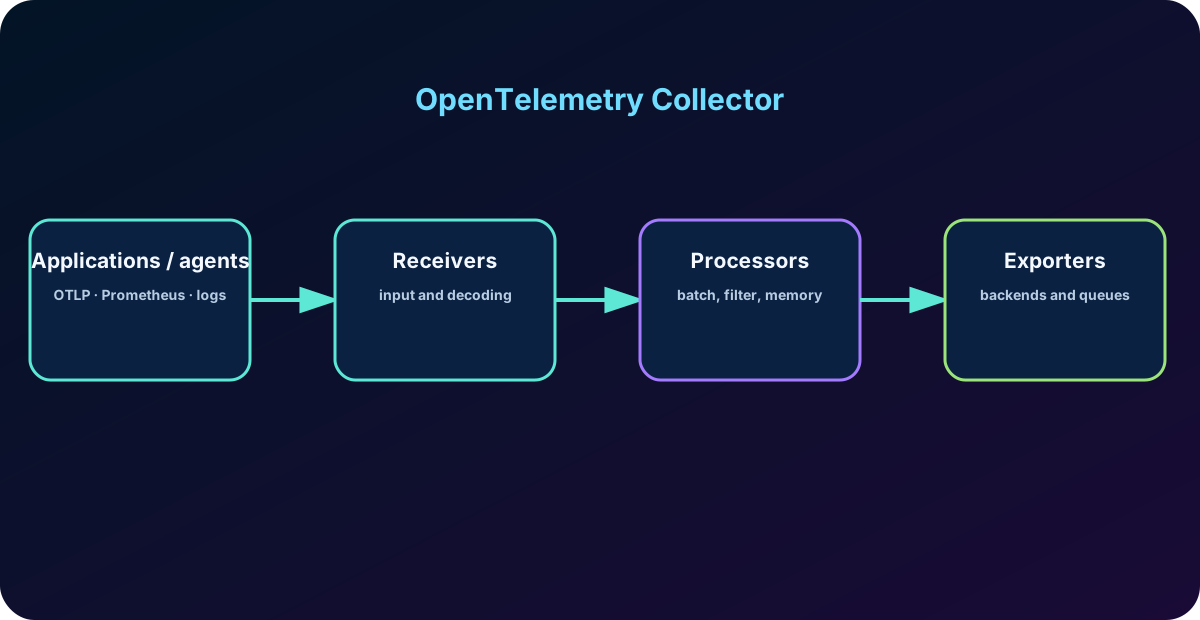
The OpenTelemetry Collector receives, processes, and exports telemetry. Receivers accept and other formats. Processors apply batching, filtering, transformation, enrichment, sampling and memory protection. Exporters send data to backends. Extensions provide auxiliary capabilities such as health checks and authentication. Pipelines are declared by sign.
The Collector can be deployed as an agent close to the application, a central gateway per cluster or region, or a combination in layers. The agent pattern reduces hops and collects local data; The gateway pattern centralizes backend processing and credentials. The design must consider availability, persistent queues, isolation per tenant, scalability and the risk of making the Collector a single point of failure.
Figure 3 - Collector decouples applications from backends and applies processing in pipelines.
define common names, types, and meanings for attributes, names, metrics, and units. Without these conventions, each team could register an HTTP method as method, httpMethod or verb, making corporate dashboards unfeasible. Standardization allows you to consult services written in different languages with the same logic.
describes the entity that produced the telemetry. Attributes like service.name, service.version, deployment.environment.name, host, container, and Kubernetes help you locate the source. should not be confused with operation attributes: service.name describes the issuer; http.route describes the request.
Not all have the same level of stability. Governance must record the adopted version, track experimental changes, and prevent silent renames. Tel Weaver and schema tools can help organizations validate telemetry contracts, but the discipline starts with a clear catalog of allowed attributes.
32.10 Sampling, controlled loss and preservation of useful traces
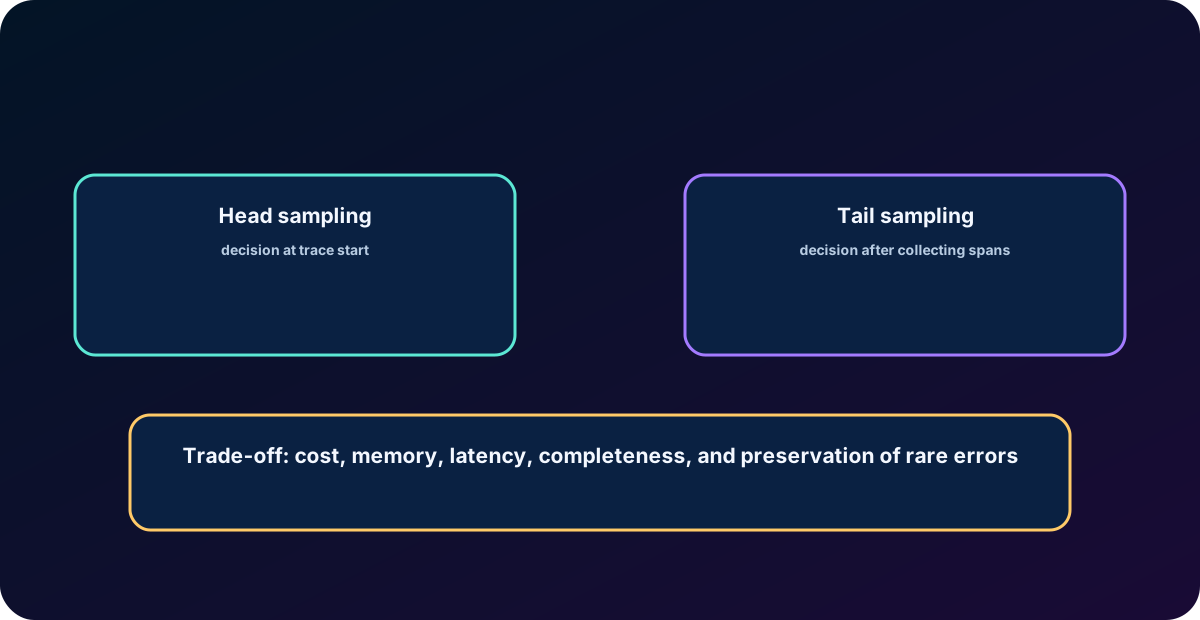
Sampling reduces volume. decides at the beginning, using probability, parent context or local rules. It's cheap and fast, but you don't know the end result. A rare error can be ruled out before it happens. Parent-based sampling helps maintain consistency between child spans and the decision.
decides after gathering enough spans in the Collector or backend. It can preserve traces with errors, high latency, or specific attributes. On the other hand, it requires memory, waiting, consistent routing of spans of the same and capacity planning. A distributed deployment without affinity may make incomplete decisions.
The policy must reflect objectives: maintaining 100% errors, traces above , representative samples per route and a small percentage of healthy traffic. Sampling does not correct poorly designed telemetry. Even discarded traces can contribute to derived metrics, depending on the point at which aggregation occurs.
Figure 4 - Head and have different costs and decision capabilities.
32.11 Exemplars and correlation between metrics, logs and traces
Exemplary associates a metric observation with a representative or context. By observing a high latency bucket, the operator can open a real that contributed to that value. This navigation reduces the jump between aggregated and individual evidence, especially in latency tail incidents.
Logs can also carry trace_id and span_id. The ideal correlation allows you to navigate from an alert to the series, from the series to an , from the to the , and from the to logs of the same execution. This experience relies on consistent instrumentation, time synchronization, compliant retention, and cross-backend integration.
Correlation should not be used to copy all data for all signals. Metrics remain aggregated; traces remain selective; logs continue events. The objective is to maintain common navigation keys and semantics, preserving the economic and operational advantages of each model.
32.12 ,, error budget and alerts
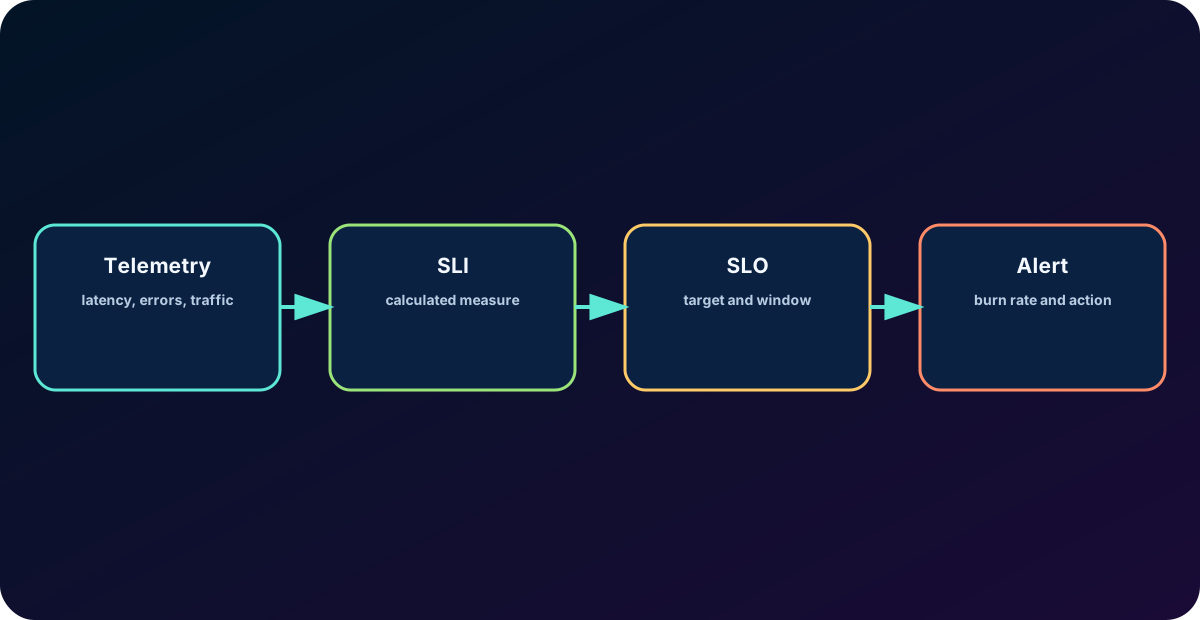
is a measurement of observed behavior, such as the proportion of valid requests that complete successfully below a latency threshold. sets the target to a window, for example 99.9% in 30 days. The error budget represents the number of failures tolerated before exceeding the target. This approach connects telemetry to user expectation.
Infrastructure-only alerts produce many false positives and false negatives. High CPU may be normal; Low CPU can coexist with complete unavailability due to DNS error. Burn rate alerts observe how quickly the error budget is consumed and can combine short and long windows to balance speed and stability.
Dashboards must follow operational questions. For APIs, the golden signals - latency, traffic, errors and saturation - are a good starting point. However, route, consumer, region, version, and backend need to be controlled dimensions. Panels without owner, and associated action become decoration.
Figure 5 - Telemetry only becomes reliability when it feeds objectives and decisions.
32.13 Observability in API Gateways, Kubernetes and messaging
API Gateway must register the edge and the upstream separately. Total duration, time to backend, status produced by the gateway, upstream status, policy that failed, route, consumer and are different evidence. A 502 needs to indicate whether there was a DNS failure, connect timeout, TLS, reset, or invalid response from the backend.
In Kubernetes, Resources and infrastructure attributes connect the logical service to cluster, namespace, workload, pod, container, and node. Collector can enrich telemetry with environmental metadata. The design needs to tolerate ephemeral pods, rollouts, and IP changes without treating the instance as a permanent identity.
In messaging, causality may not form a simple tree. Production, storage, consumption, retries and DLQ occur at different times. Links and semantic attributes help relate messages. Lag metrics, message age, redelivery rate and queue depth complement traces, but need to be interpreted within the broker's semantics.
Table 6 - Each layer has its own signals, but the journey needs to remain correlatable.
Layer
Essential metrics
Detailed evidence
Gateway
Requests, latency, errors, upstream time, TLS failures.
through policy and routing logs.
Kubernetes
CPU, memory, restarts, throttling, availability.
attributes, events and pod logs.
Messaging
Lag, depth, throughput, age, redelivery.
Producer/consumer spans and message IDs controlled.
32.14 Security, privacy and integrity of telemetry
Telemetry is a sensitive asset. It can reveal internal topology, service names, versions, failures, user identifiers, and security decisions. The pipeline must use authentication, encryption in transit, tenant segregation, access controls, retention, and administration trail. Collectors should not accept data from any source without validation.
propagation crosses external borders and needs policy. Received IDs can be accepted, regenerated or related by links depending on the risk and need for correlation. must be filtered. Authentication logs need to avoid tokens and credentials; SQL or HTTP attributes should not log sensitive values by default.
Integrity also matters. An attacker may attempt to hide activity by reducing telemetry, flooding the pipeline, or injecting misleading fields. Limits, mutual authentication, schema validation, monitoring the Collector itself, and immutable storage for auditing reduce this risk.
Telemetry is not an LGPD-free area
Observational data remains subject to purpose, minimization, retention, access and security. A ID may not identify a person on its own, but logs and often carry context that makes correlation possible.
32.15 Pipeline costs, retention, cardinality and capacity
Observability costs CPU, memory, network, storage, indexing and querying. The cost arises in the instrumentation and is multiplied by volume, cardinality and retention. An application that adds five high cardinality attributes can increase series and indexes much more than the traffic growth suggests.
The strategy must define retention tiers, sampling, compression, aggregation and signal routing. Debug logs may remain for a few days; aggregated metrics can have long retention; full traces can be sampled; Auditing follows its own policy. Collector allows you to filter, transform, and forward data to different destinations before paying the full cost on the backend.
The pipeline also needs . Internal queues, dropped spans, export failures, memory denials, processing time and Collector CPU usage must be monitored. An observability platform that silently loses data can lead teams to incorrect conclusions during incidents.
32.16 Observability troubleshooting
When a is broken, check the propagation first. Did the client inject traceparent? Did the gateway preserve or recreate the context? Did the service library extract the header? Did asynchronous calls load the correct context? A failure at any hop creates separate traces, even if all components are instrumented.
When metrics disappear, investigate the instrument, views, temporality, export interval, filters, and cardinality. In logs, check parsing, timestamp, multiline, encoding and severity mapping. In the Collector, examine health, queues, memory limiter, batch, retries and exporter errors. The pipeline itself needs to emit telemetry to be diagnosed.
Time differences produce spans with impossible order and logs outside the window. Clock synchronization is a basic requirement. It is also common for empty or inconsistent service names to group different applications together on the backend. A checklist of Resources and must be part of the deployment.
Table 7 - Diagnosis begins by separating generation, propagation, processing and storage.
Symptom
Hypothesis
Evidence
Split
Context not propagated or incompatible format.
Headers/metadata at each jump.
Missing spans
Sampling, shutdown without flush or exporter failing.
SDK logs and Collector metrics.
Metric explodes
High cardinality .
Count of series per label.
Uncorrelated logs
traceid/spanid not injected.
Appender configuration and active context.
Collector discards data
Memory limit, queue full or backend unavailable.
Internal telemetry and exporter errors.
32.17 Case studies and labs
Case Study 1: Consumers intermittently receive 504 on a banking API. The latency metric only shows increase on one route. An opens a whose gateway consumes little time, but the backend remains close to timeout. The logs from the same indicate an exhausted connection pool. Correlation avoids changing gateway policies unnecessarily.
Case study 2: After a rollout, the cost of metrics increases tenfold. Investigation shows that a new version added customer_id as a histogram . The fix removes the identifier from the metric and preserves it only in sampled spans and authorized logs. The incident demonstrates why telemetry needs contract review.
Case study 3: Kafka messages appear as separate traces from the original request. The producer created spans, but did not inject context into the message headers. After correcting the propagation and using links in the consumer when appropriate, the platform begins to reconstruct the asynchronous journey without forcing an incorrect hierarchy.
Suggested labs
1) Instrument an API with self-instrumentation and a manual business . 2) Propagate traceparent through the gateway and confirm continuity. 3) Configure a Collector with receiver, memory_limiter, batch and two exporters. 4) Create a metric with low cardinality and associate exemplars. 5) Simulate error, timeout and asynchronous message and compare the three signals.
Chapter summary
Observability is the ability to explain the internal behavior of systems based on external signals. Logs, metrics and traces have different models and must be correlated by , distributed context and . The quality of the correlation is more important than the quantity of data.
OpenTelemetry separates APIs, SDKs, instrumentations, protocol and Collector. This architecture enables vendor-agnostic instrumentation, centralized processing, and export to multiple backends. The Collector, however, needs to be designed as a critical component, with its own capacity, queues, security and telemetry.
Sampling, exemplars, SLOs and alerts transform signals into decisions. Cardinality, privacy and cost need to be addressed by design. In gateways, Kubernetes, and messaging, each layer produces specific evidence, but the full journey only appears when context and semantics cross all boundaries.
Next step of the course
The next chapter delves deeper into Kubernetes for APIs, connecting workloads, Services, Ingress/Gateway API, probes, autoscaling, security and operations to the observability practices presented here.
Observability checklist
Each service defines service.name, version, environment, and ownership consistently.
Logs are structured, correlatable, and do not contain secrets or unnecessary personal data.
Metrics use correct instruments and low cardinality attributes.
Spans describe stable operations, dependencies, errors, and timing without copying entire payloads.
is propagated across HTTP, gRPC and messaging, respecting trust boundaries.
and their stability are governed as a contract.
Sampling preserves errors, high latency and healthy traffic representation.
Collector has memory limiter, batch, queues, retries, health checks and internal telemetry.
Dashboards and alerts are linked to SLIs, SLOs, owners and known actions.
Costs, retention, cardinality, and privacy are reviewed before production.
Exercises
Differentiate between telemetry, monitoring, observability and auditing.
Explain why trace_id is inappropriate as a metric label.
Describe ,, event, link, status and .
Explain traceparent and tracestate in a distributed HTTP call.
Compare manual instrumentation and self-instrumentation.
Design a Collector pipeline with receivers, processors and exporters.
Compare and .
Explain how exemplars connect metrics and traces.
Propose an availability and a latency for an API.
List controls to prevent exposure of tokens and PII in telemetry.
Describe how to diagnose a broken between gateway and backend.
Propose a laboratory to correlate HTTP request, message and asynchronous processing.
Glossary
Table 8 - Essential vocabulary of the chapter.
Term
Definition
Key-value pair associated with ,, metric or log.
Application context propagated between processes.
Metric observation associated with a or representative context.
Sampling decision made at the beginning of the .
Log record model in OpenTelemetry.
OpenTelemetry native transport protocol.
Entity that produces telemetry.
Standard names and meanings for telemetry.
Quantitative indicator of observed behavior.
Goal set for an in a window.
Unit of work timed within a .
Sampling decision after observing spans.
Causal representation of a distributed operation.
W3C Distributed Context Propagation Standard.
Configuration that changes metric aggregation and attributes in the SDK.
Technical references
OpenTelemetry. What is OpenTelemetry? and Observability Primer.
OpenTelemetry. Concepts: Signals, Traces, Metrics, Logs, and Context Propagation.
OpenTelemetry Specification. Overview, Tracing, Metrics and Logs.
OpenTelemetry .
OpenTelemetry Collector: Architecture, Configuration, Deployment Patterns and Scaling.
W3C. Level 2.
W3C. .
Google SRE. Service Level Objectives and Error Budgets.
CNCF. OpenTelemetry project documentation.
Update note
OpenTelemetry evolves sign by sign, and can be stable or experimental. Before standardizing attributes, exporters or declarative configuration, validate the status of the adopted version and test migrations in a controlled environment.