Microsoft Defender XDR, Incidents, and the Unified Portal
Cross-domain correlation, attack story, multistage incidents, Automated Investigation and Response, Action center, advanced hunting, KQL, custom detections, and unified operations
Suggested study time: 40 minutes • Beginner level • Aligned with the SC-900 study plan and official Microsoft Learn documentation
By João Ricardo Dutra••Complete material
1. Introduction: when the perimeter fragments, the investigation needs to unite
For many years, digital protection was organized into separate tools: antivirus for computers, filters for email, sensors for networks, and auditing systems for identities. This approach matched a world in which users, applications, and data remained closer to the data center. With the cloud, remote work, SaaS applications, and mobility, a single attack began to cross multiple surfaces in just a few minutes.
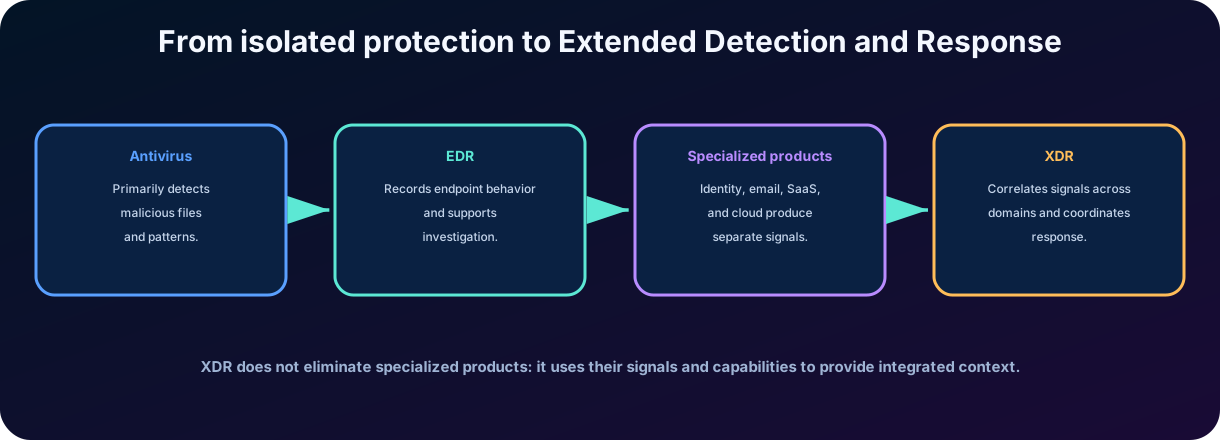
solutions have expanded endpoint visibility, recording processes, files, connections, and behaviors. However, a phishing campaign can start in email, steal an identity, execute code on a device, and access data in a cloud application. If each product shows only a part, the analyst receives multiple alerts without immediately understanding that they belong to the same story. The concept of emerged to correlate detection and response across domains.
This evolution benefits the reader by offering a mental model closer to real attacks. For society, it represents a greater ability to protect essential services, personal data, financial institutions, schools, and public services. Throughout the chapter, you will notice that the value of is not simply in generating more alerts, but in transforming scattered signals into a coherent and actionable investigation.
Figure 1 - Evolution of isolated protection to Extended Detection and Response.
2. What is ?
stands for Extended Detection and Response. It is an approach that collects and correlates signals from multiple attack surfaces, provides an integrated view of the incident, and allows response actions to be executed on connected products. The term "extended" indicates that the analysis goes beyond a single endpoint or technology domain.
2.1 is not just a single console
Placing links to different tools on the same page does not create . The essential feature is correlation: recognizing that a malicious email, an unusual login, a suspicious process, and a data transfer can be steps of the same campaign. It is also important to share entities, evidence, timeline, verdicts, and response actions.
Approach
Focus
Limitation or differential
Antivirus
Malicious files and patterns on the device.
Important preventive protection, but limited context of the full attack.
EDR
Telemetry, detection, investigation, and response on the endpoint.
Depth on the device; it does not alone cover all identity, email, and SaaS.
SIEM
Centralization and analysis of data from many sources.
Broad and flexible visibility; depends on ingestion, rules, and SOC operation.
XDR
Integrated correlation and response across security domains.
Produces an attack story with native context and coordinated actions.
SOAR
Orchestration and automation of response processes.
Executes workflows; can complement SIEM and XDR.
Key point for the SC-900 Microsoft Defender XDR integrates signals and responses from various Defender solutions. Microsoft Sentinel is a SIEM with SOAR capabilities. In the unified portal, the two can work together, but they still represent distinct concepts.
3. Microsoft Defender : proposal and conceptual architecture
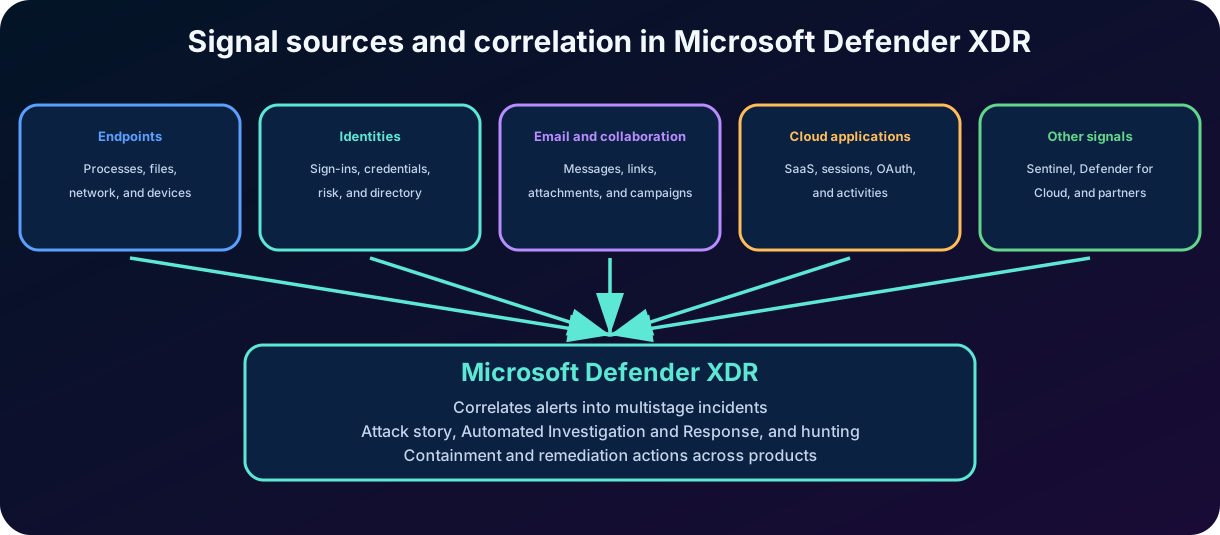
Microsoft Defender is Microsoft's solution to correlate signals, alerts, and threat data across different surfaces. The goal is to enable the security operations team to investigate the attack as a whole, instead of switching between consoles and manually reconstructing relationships between identities, devices, messages, and applications.
Figure 2 - Signal sources and correlation capabilities of Microsoft Defender .
3.1 Core capabilities
Collection of signals and alerts produced by integrated solutions.
Automatic correlation of related alerts in incidents.
with chronology and relationships between entities and assets.
Central queue for screening, assignment, classification, and monitoring.
Automated investigation and response for supported entities.
in data from different domains.
Containment and remediation actions, according to product, license, and permits.
Integration with Microsoft Sentinel and Security Copilot in the Microsoft Defender portal.
Context, not magic
The correlation reduces manual work and noise, but it does not guarantee that every grouping is correct. The analyst must validate chronology, scope, legitimacy of actions, and impact on the business.
4. Products, signs, and attack surfaces
Solution or source
Observed surface
Examples of signs
Microsoft Defender for Endpoint
Devices and endpoints.
Processes, files, connections, vulnerabilities, behavior, and endpoint alerts.
Microsoft Defender for Identity
Identities and Active Directory.
Recognition, lateral movement, suspicious changes, and credential abuse.
Microsoft Defender for Office 365
Email and collaboration.
Phishing, links, attachments, campaigns, mailboxes, and messages.
Microsoft Defender for Cloud Apps
SaaS applications and cloud activities.
Sessions, OAuth, anomalous activities, Shadow IT, and application governance.
Microsoft Entra ID Protection
Identity and entry risk.
Leaked credentials, anonymous IP, unusual login, and user risk.
Microsoft Sentinel
Data and alerts from Microsoft and non-Microsoft sources.
Incidents, analytical rules, hunting, and automation in the context of SIEM/SOAR.
Microsoft Defender for Cloud
Workloads and resources in the cloud.
Alerts for servers, containers, databases, storage, and other workloads.
4.1 Signal, telemetry, and alert
Telemetry is the set of records and observations produced by the services. A signal is relevant information extracted from this universe. A detection evaluates signals and can generate an alert. uses alerts, entities, intelligence, and temporal relationships to form incidents. The amount of data is huge; therefore, the goal is not to display everything to the analyst, but to highlight what deserves investigation.
Licenses and availability
Not every organization has all the products, plans, or features. The experience presented on the portal depends on licenses, configuration, connected data, and assigned permissions.
5. Events, alerts, incidents, entities, assets, and evidence
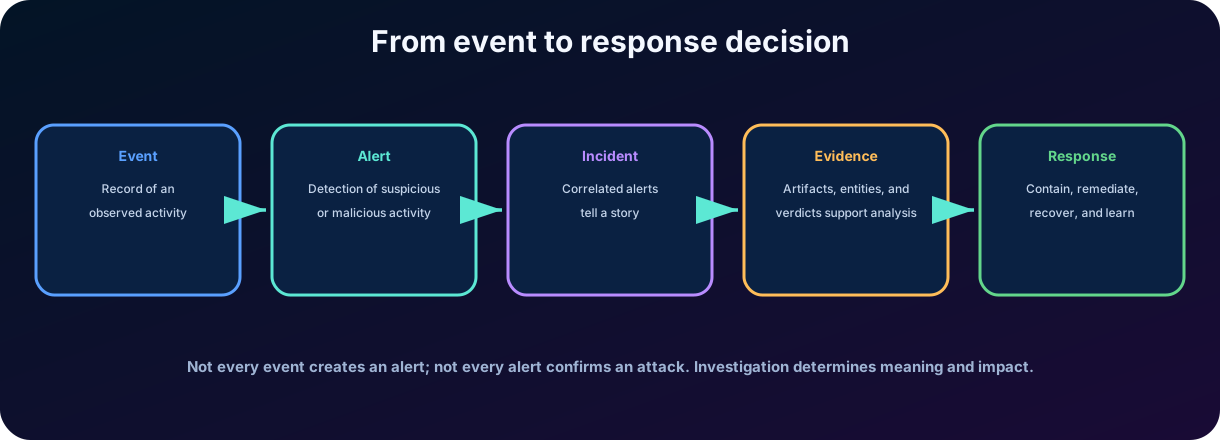
Figure 3 - Relationship between recording, detection, investigation, and response.
Term
Practical definition
Event
Record of an activity, such as login, process creation, email delivery, or application access.
Alert
Signal produced when a detection identifies suspicious or malicious activity.
Incident
Collection of correlated alerts and associated data that represent the history of a possible attack.
Entity
Object involved in the investigation, such as user, device, file, process, IP, URL, or mailbox.
Active
Organizational resource that can be affected or protected, such as a device, user, application, mailbox, or cloud resource.
Evidence
Information or artifact used to confirm, refute, or contextualize the attack hypothesis.
Verdict
Assessment assigned to evidence or entity, such as malicious, suspicious, or clean/no threat found.
Remediation
Action to contain or correct the risk, such as quarantine, isolation, lockdown, or removal.
Common trap An alert is not synonymous with a confirmed incident. An incident can contain several alerts, and the investigation can classify it as a true positive, false positive, expected activity, or another outcome adopted by the organization.
6. Correlation, multi-stage incidents, and
Modern attacks use various techniques: initial access, execution, persistence, privilege escalation, lateral movement, collection, and exfiltration. Each step can appear in a different source. The correlation mechanism analyzes temporal proximity, shared entities, techniques, intelligence, and relationships between signals to group alerts into an incident.
6.1
The presents a visual and chronological narrative of the incident. It helps answer where the attack started, which alerts occurred, how entities are related, which assets were affected, and how far the attacker advanced. The graph can connect users, devices, mailboxes, applications, IPs, files, and processes.
Timeline: shows the order of alerts and activities.
Incident graph: represents relationships between entities and assets.
Scope: summarizes devices, users, mailboxes, and other impacted resources.
: relates alerts to adversary tactics and techniques.
Recommended actions: guide investigation and response according to the context.
Activity history: records manual and automatic changes to the incident.
Why does correlation reduce fatigue?
Instead of five rows with five disconnected alerts, the analyst may receive a multi-step incident. This reduces duplication, but increases the responsibility of verifying that the grouping and priority reflect the real environment.
7. Microsoft Defender portal and unified operations
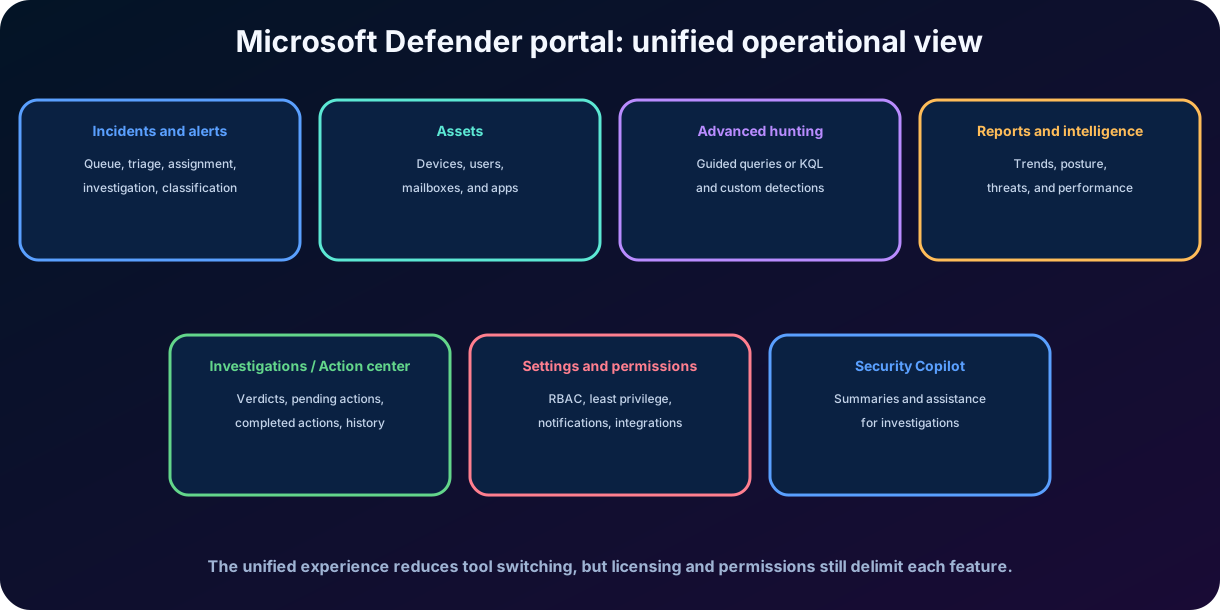
The Microsoft Defender portal is the central experience for investigating and responding to threats in integrated products. It brings together incidents, alerts, assets, hunting, automated investigations, , reports, intelligence, and settings. The integration of Microsoft Sentinel extends this experience with SIEM and SOAR capabilities.
Figure 4 - Conceptual areas of the Microsoft Defender portal.
7.1 What does "unified portal" mean?
Unified means that data and workflows from various solutions can be viewed and operated in a common experience. This does not make all functions identical nor eliminate licensing and permission boundaries. An analyst can view an incident, but not necessarily perform all actions on endpoint, email, or identity.
7.2 Access control
Access must follow the principle of least privilege. Reading, investigation, hunting, and remediation functions need to be granted according to responsibility. The organization should also separate those who propose, approve, and carry out critical actions when operational risk justifies this segregation.
8. Incident queue: triage, priority, and management
The incident queue is the entry point for the SOC's daily work. It organizes incidents created from different sources and allows filtering, sorting, searching, assigning, and tracking cases. Good triage prevents the team from treating all incidents as equivalent.
Field or action
Operational purpose
Severity
Indicates the estimated potential impact. High severity usually requires faster attention.
Priority
Combines context, criticality, rarity, and other factors to prioritize the work.
Status
Represents the stage, as new, in progress, or resolved.
Responsible
Define who conducts the screening or investigation.
Classification
Record the result as a true positive, false positive, or expected activity.
Tags
They add operational context, campaign, team, environment, or procedure.
Detection sources
They show which products or rules contributed to the incident.
Impacted assets
They help to assess the scope and criticality of the business.
8.1 Recommended screening
1. Confirm whether the incident is new, duplicate, or part of an already known case.
2. Assess the severity, priority, criticality of assets, and possible impact.
3. Review alerts, sources, tactics, and initial timeline.
4. Assign responsible person, status, and appropriate tags.
5. Decide whether it is necessary to investigate, escalate, contain immediately, or close with justification.
Severity is not final impact
Severity is a technical estimate. A medium alert on a critical administrative account may deserve higher priority than a high alert on an isolated lab asset.
9. Incident page and detailed investigation
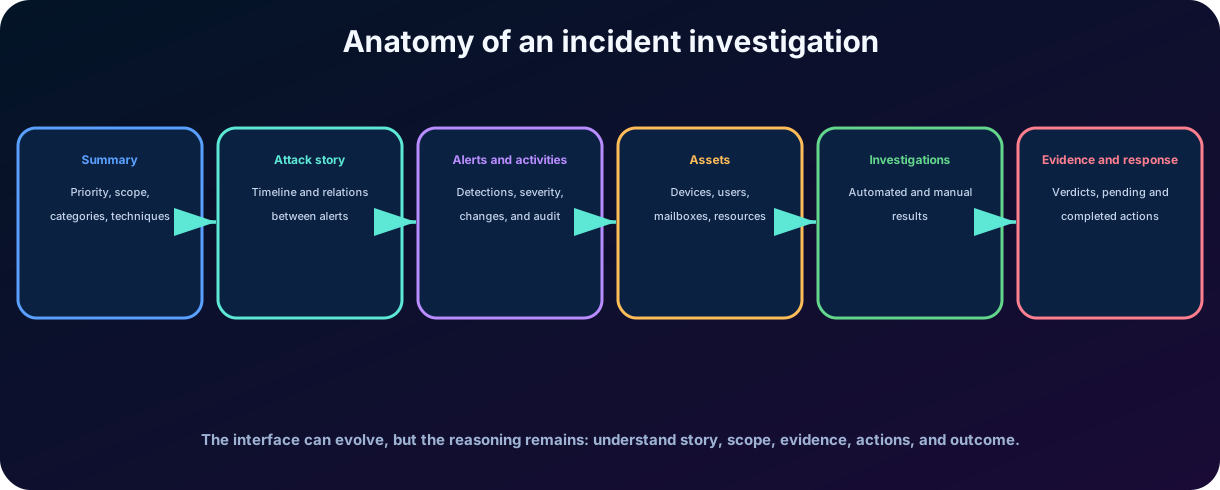
Figure 5 - Conceptual components of an incident investigation page.
9.1 Summary and scope
The summary provides a quick read of the relative importance of the incident: alerts, categories, techniques, impacted assets, evidence, and properties. The goal is to guide the investigation without requiring the analyst to open each artifact immediately.
9.2 Alerts and activities
The alerts area shows related detections and their chronological order. The activities area records human and automated actions, such as severity changes, assignment, comments, merges, automations, and remediations. This history is essential for auditing and shift handover.
9.3 Investigations and evidence
Automated investigations examine supported entities and record results. The evidence and response section consolidates files, processes, emails, IPs, and other analyzed objects, their verdicts, and the remediation status. From it, pending actions can be approved or rejected, according to permissions.
Questions that guide the investigation
What was the initial vector? Which accounts and devices were affected? Was there persistence, lateral movement, or exfiltration? Does the attacker still have access? What evidence supports each conclusion?
10. Assets, entities, and risk monitoring
The portal offers asset-centered views so that the analyst does not rely solely on the incident perspective. A user can appear in multiple incidents; a device can accumulate alerts and vulnerabilities; a mailbox can participate in a campaign. The aggregated view helps to identify recurrence, criticality, and relationships.
Type of asset
What can be analyzed
Device
Alerts, connected users, processes, files, vulnerabilities, isolation, and timeline.
User or identity
Alerts, entries, risk, devices used, privileges, movement, and associated incidents.
Mailbox
Messages, campaigns, suspicious rules, deliveries, and remediation actions.
Cloud application
Activities, sessions, OAuth permissions, anomalies, and users.
File, URL, IP or domain
Reputation, occurrences, devices, alerts, and related intelligence.
Cloud resource
Alerts, workload context, and relationships with other assets, when integrated.
10.1 User and device risk
Risk is a contextual indicator, not a condemnation. A user may show signs of compromised credentials; a device may exhibit malicious behavior or high exposure. The analyst must combine the indicator with criticality, history, authentication, evidence, and investigation results.
Entity versus asset
An entity is an object used to relate and investigate signals. An asset is an organizational resource with value and impact. In many cases, such as a user or device, the same object can be treated from both perspectives.
11. Automated Investigation and Response ( )
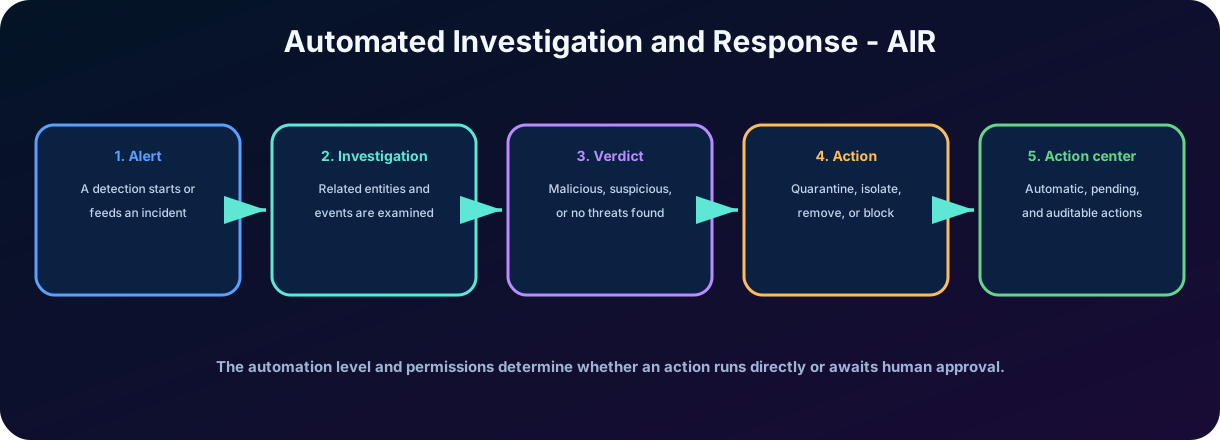
, from Automated Investigation and Response, helps to deal with large volumes of alerts. When an alert creates or feeds an incident, an automated investigation can examine related events and entities, produce verdicts, and identify remediation actions. The goal is to reduce repetitive tasks and speed up containment, without removing human governance.
Figure 6 - Simplified flow of automated investigation and response.
Verdict
Operational meaning
Malicious
The evidence exhibits behavior or characteristic associated with a confirmed threat.
Suspect
There are relevant indications, but the context may require additional validation.
No threat found / clean
The automated analysis did not identify any threat in the evaluated artifact.
Pending or not supported
The analysis is not finished, it requires action or the type of evidence is not covered in that flow.
11.1 Examples of remediation
Send file to quarantine.
Interrupt malicious process.
Isolate device from the network.
Block URL, hash, or other indicator.
Remove malicious message or content.
Disable or protect identity, according to integration and procedure.
Responsible automation
Actions can be automatic or require approval. Before increasing the level of automation, test scenarios, define rollback, protect service accounts, and assess the impact of false positives.
12. : governance of response actions
The centralizes pending and completed remediation actions in integrated products. It functions as an operational and audit log: it shows what was proposed, executed, approved, rejected, or reverted, when applicable. This allows the team to track the outcome of automation and manual interventions.
Item type
Example
Analyst's decision
Pending action
Quarantine file or remove message.
Approve or reject after evaluating evidence and impact.
Action completed
Isolated device or interrupted process.
Confirm efficacy and check for side effects.
Manual action
Response initiated during hunting or investigation.
Document reason, scope, and person responsible.
Failed action
Remediation not performed due to permission, connectivity, or asset status.
Investigate the cause and adopt an alternative.
Auditable history
Record of actions performed by products and operators.
Use in review, compliance, and lessons learned.
12.1 Approval and least privilege
The ability to visualize an incident does not imply permission to isolate a device, remove emails, or change an identity. Each action depends on roles and permissions in the corresponding products. The recommended model grants only what is necessary and clearly records who initiated or approved the remediation.
Test point
investigates and recommends or executes actions. The is the unified place to review pending and completed actions. Do not confuse the with the incident queue.
13. and Kusto Query Language
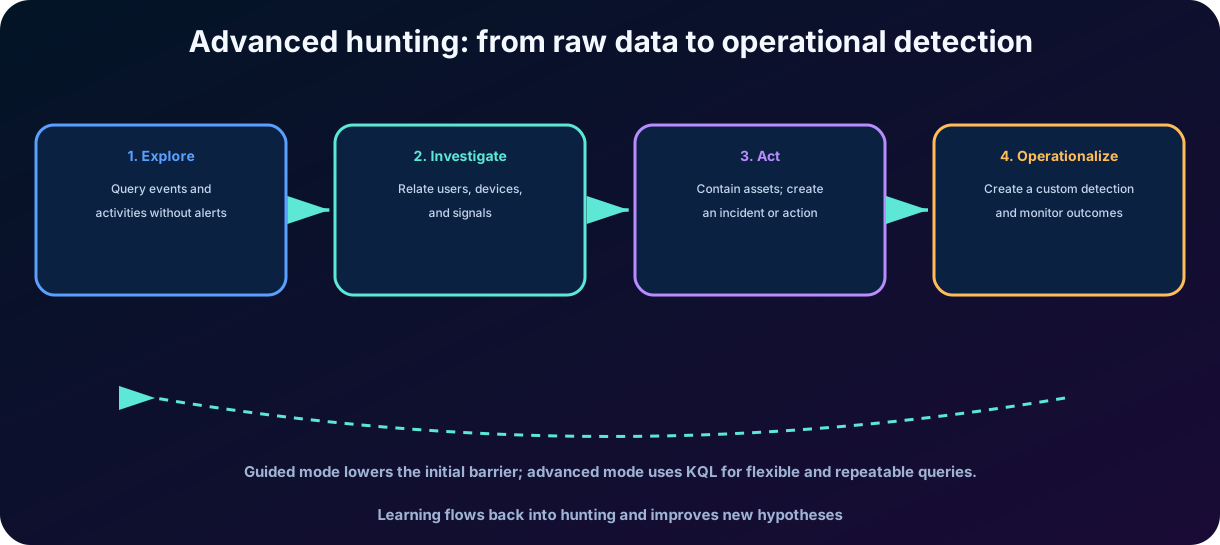
is the query tool for exploring raw data and proactively looking for threats. It allows correlating activities across different surfaces, testing hypotheses, and investigating indicators without relying on an existing alert. The portal offers a guided mode to build queries with less knowledge of syntax and an advanced mode to write .
Figure 7 - Hunting cycle, response, and creation of detections.
DeviceProcessEvents | where Timestamp > ago(1d) | where FileName in~ ('powershell.exe', 'pwsh.exe') | where ProcessCommandLine has_any ('EncodedCommand', 'FromBase64String') | project Timestamp, DeviceName, AccountName, FileName, ProcessCommandLine | order by Timestamp desc The query illustrates the search for PowerShell with arguments associated with encoded content. The result does not prove maliciousness: legitimate administrative tools can also use encoding. The analyst should correlate signature, origin, user, device, process tree, and other signals.
13.1 From hunting to personalized detection
A query that consistently identifies relevant behavior can give rise to a custom detection. This detection runs periodically and generates alerts when the criteria are met. Thus, an investigative hypothesis becomes a repeatable operational capability.
14. Reports, intelligence, and executive visibility
Reports turn activities and results into understandable trends. They help assess the volume of alerts, incidents, response times, sources of detection, observed threats, affected assets, and effectiveness of actions. The exact availability of reports depends on the products and licenses present on the portal.
Resource
Question that helps to answer
Operational reports
How many incidents were received, investigated, closed, and remediated?
Threat analytics
Which campaigns, vulnerabilities, or threat actors require attention?
Microsoft Secure Score
Which configuration actions can improve the security posture of Microsoft 365?
Product dashboards
How are endpoints, email, identity, or applications behaving?
Hunting and saved queries
What patterns, entities, or indicators appear in the data?
Incident export and summary
How to document the investigation, evidence, actions, and conclusion?
14.1 Metrics and interpretation
MTTD: mean time to detect.
MTTA: average time to acknowledge or take on the case.
MTTR: average time to respond or remediate, according to the adopted definition.
rate and reopened incidents.
Percentage of automated and pending remediations.
Coverage of assets and telemetry sources.
Beware of isolated metrics
Reducing closure time does not mean improving safety if incidents are closed without proper investigation. Metrics need to be combined with quality, impact, and learning.
15. Integrated practical scenario: from phishing to exfiltration
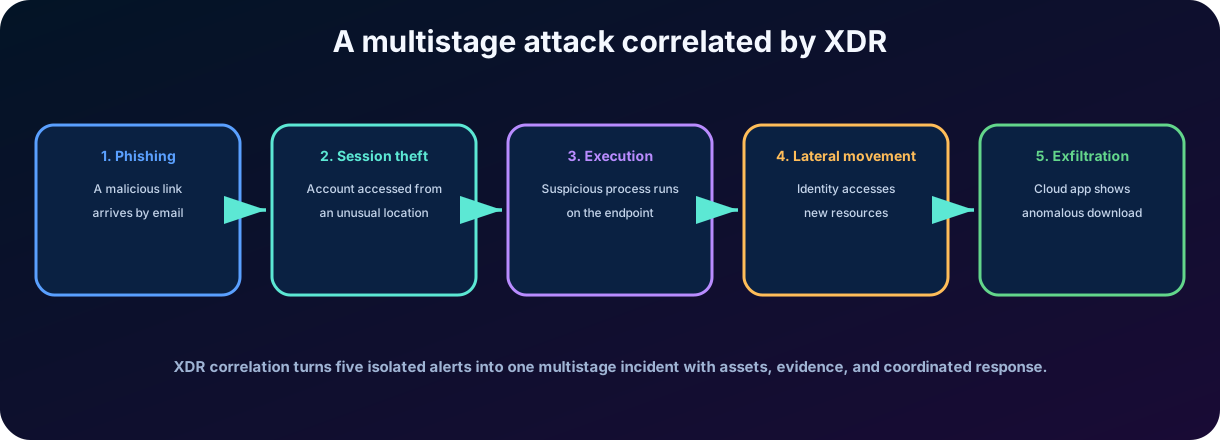
Figure 8 - Example of a multi-stage attack correlated by .
1. Defender for Office 365 detects a phishing message with a malicious link delivered to a user.
2. The user accesses the link and the identity shows an unusual login, accompanied by high risk.
3. On the endpoint, a suspicious process executes commands and establishes persistence.
4. Defender for Identity identifies anomalous account use and lateral movement attempts.
5. Defender for Cloud Apps observes unusual large-volume downloads in a SaaS application.
6. Defender correlates alerts into a multi-stage incident and builds the .
7. analyzes evidence, recommends quarantine, isolation, and other actions; pending items appear in the .
8. The analyst validates the scope, contains the account and the device, removes messages, checks persistence, and records the classification.
9. A hunting query looks for the same indicators in other users and devices; the team creates custom detection for recurrence.
Result of the integrated model
The value is not just closing an alert, but understanding the entire attack, containing each affected surface, checking for propagation, and turning the investigation into permanent improvement.
16. Good practices, limitations, and conceptual pitfalls
16.1 Good operational practices
Connect and keep relevant telemetry sources healthy.
Define roles, escalation, response times, and classification criteria.
Prioritize critical assets and privileged accounts.
Use tags, comments, and activities to preserve context between turns.
Test automations and require approval for high-impact actions when necessary.
Review false positives and turn lessons into detection adjustments.
Use hunting to check range and look for unalerted signs.
Protect the portal with MFA, least privilege, and monitoring of administrative activities.
16.2 Recurring pitfalls in SC-900
Incorrect statement
Correction
XDR is just another name for SIEM.
XDR correlates signals and responses across domains; SIEM centralizes and analyzes broad telemetry.
Every suspicious event is already a confirmed incident.
Event is a record; alert is detection; incident is a correlated case that still needs to be investigated.
AIR eliminates the need for the analyst.
AIR reduces tasks and speeds up response, but decisions, approvals, and validation are still necessary.
Action center and incident queue are the same thing.
The queue organizes incidents; the Action center organizes remediation actions.
Hunting is only used to consult existing alerts.
Hunting explores raw data to look for known or yet undetected threats.
Visibility ensures remediation permission.
Actions depend on specific roles, licenses, and permissions.
16.3 Quick review
correlates signals from various surfaces.
Defender creates an in incidents.
The portal unifies investigation, assets, hunting, actions, and reports.
produces verdicts and actions; controls the follow-up.
uses guided mode or .
17. Conclusion
Microsoft Defender addresses a core problem of modern security: attacks cross products, identities, devices, messages, and applications, but teams cannot investigate every signal as if it were independent. By correlating alerts, entities, assets, and evidence, the solution provides a more complete story and reduces the effort required to reconstruct the attack.
The Microsoft Defender portal organizes this operation into queues, incident pages, , assets, automated investigations, , hunting, and reports. Each resource plays a specific role: the queue prioritizes cases; the investigation explains what happened; analyzes and suggests corrections; the governs actions; hunting looks for what detections have not yet found.
In my assessment, the greatest contribution of is not to replace the analyst, but to multiply their reasoning capacity. Automation and correlation eliminate part of the mechanical work, while people remain responsible for interpreting context, assessing impact, and deciding proportional responses. This balance between technology, process, and human judgment is the most important point to take to the SC-900 and to professional practice.
To continue studying
In the next chapter, the focus shifts from the portal and correlation to the products that feed this ecosystem: Defender for Office 365, Endpoint, Cloud Apps, and Identity. Understanding each component will make the vision even more concrete.
Summary in one sentence
Microsoft Defender correlates security signals across multiple surfaces, organizes related alerts into incidents, and provides investigation, hunting, and response in the Microsoft Defender portal.
18. Review questions
Question 1
An organization receives separate alerts of phishing, anomalous login, and suspicious execution on the device. Which capability of Microsoft Defender helps to understand that they are part of the same attack?
A) Secure Score
B) Correlation of alerts in an incident and
C) Only the
D) Only a monthly report
Commented answer
Correct answer: B. correlates alerts and entities from different surfaces in an incident, providing a story of the attack. The tracks remediation actions, it does not perform all the correlation on its own.
Question 2
Which alternative correctly differentiates alert and incident?
A) An alert is always a confirmed attack; an incident is just a log.
B) An alert is a sign of a possible threat; an incident gathers alerts and context for investigation.
C) Alert and incident are identical terms.
D) The incident exists only after remediation.
Commented answer
Correct answer: B. An alert is produced by a detection. An incident organizes related alerts and associated data, but still needs to be investigated and classified.
Question 3
Where does the analyst review pending and completed remediation actions produced by automated investigations?
A)
B) Azure Inventory
C) Service Trust Portal
D) Compliance Manager
Commented answer
Correct answer: A. The centralizes pending actions, completed actions, and the remediation history across integrated products.
Question 4
Which feature allows exploring data from multiple surfaces, using , and turning a useful hypothesis into a custom detection?
A)
B) Only the incident queue
C) Azure Bastion
D) Microsoft Purview Data Map
Commented answer
Correct answer: A. allows you to query data using guided mode or , investigate threats, and create custom detections from queries.
19. Glossary and official references
19.1 Essential Glossary
Term
Meaning
XDR
Extended detection and response across multiple security surfaces.
EDR
Endpoint-centered detection and response.
Attack story
Chronological and relational representation of the stages of an attack.
AIR
Automated investigation and response.
Action center
Area to monitor and approve remediation actions.
Advanced hunting
Proactive research tool in raw data using guided mode or KQL.
KQL
Kusto Query Language, query language used in the Microsoft security ecosystem.
MITRE ATT&CK
Knowledge base of tactics and techniques used by adversaries.
True positive
Detection correctly associated with malicious activity.
False positive
Detection that seems suspicious, but does not pose a real threat.
19.2 Microsoft Learn References
Study guide for Exam SC-900: Microsoft Security, Compliance, and Identity Fundamentals - learn.microsoft.com/credentials/certifications/resources/study-guides/sc-900
O que é o Microsoft Defender ? - learn.microsoft.com/defender- /microsoft-365-defender
Microsoft Defender in the Microsoft Defender portal - learn.microsoft.com/defender- /microsoft-365-defender-portal
Investigate incidents in the Microsoft Defender portal - learn.microsoft.com/defender- /investigate-incidents
Prioritize incidents in the Microsoft Defender portal - learn.microsoft.com/defender- /incident-queue
Automated investigation and response in Microsoft Defender - learn.microsoft.com/defender- /m365d-autoir
The - learn.microsoft.com/defender- /m365d-action-center
overview in Microsoft Defender - learn.microsoft.com/defender- /advanced-hunting-overview
Editorial note
Content validated in July 2026. Microsoft continuously updates the portal, documentation, licensing models, and some research experiences.